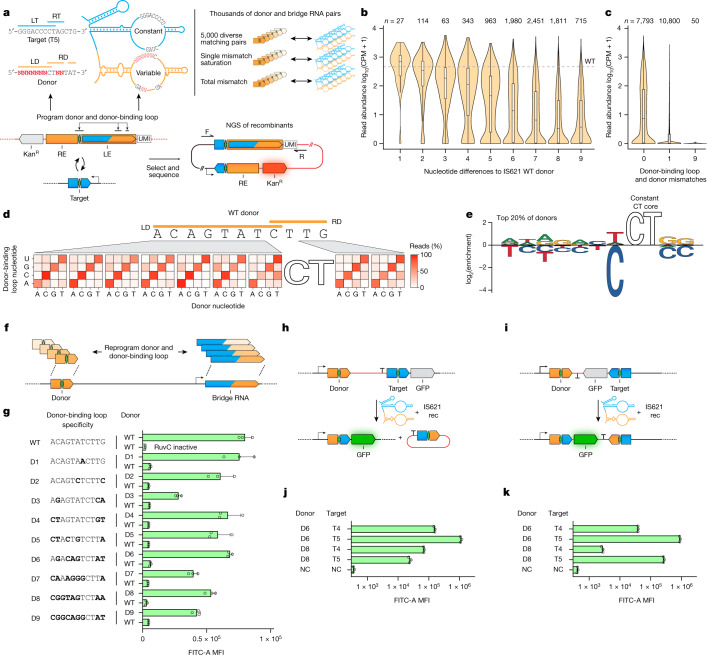
Fig. 5. Bridge RNA donor recoding enables fully programmable insertion, inversion and excision.
a, Schematic representation of the donor specificity screen. A unique molecular identifier (UMI) identifies each paired donor and donor-binding loop. b, Reprogrammability of donor sequences by the number of nucleotide differences from the WT donor. WT donor abundance is indicated by the dashed line. Average CPM of two biological replicates. Box plots show median (centre line), IQR (box edges) and 1.5 × IQR (whiskers). c, Mismatch tolerance between non-core sequences of the donor-binding loop and donor. Average CPM of two biological replicates. Box plots show median (centre line), IQR (box edges) and 1.5 × IQR (whiskers). d, Mismatch tolerance between bridge RNA donor-binding loop and donor by position, as measured by the percentage of total detected recombinants with each indicated mismatch. Average of two biological replicates. e, Nucleotide enrichment among the top 20% most efficient matched pairs of donors and donor-binding loops. f, Schematic representation of the paired reprogramming of the donor and the donor-binding loop. g, Specific recombination using reprogrammed donor and donor-binding loop sequences. Donor sequences are listed on the left, and the bridge RNA is reprogrammed to base-pair with the indicated sequence. Bold bases highlight differences relative to the WT donor sequence. Mean ± s.d. of three biological replicates. h, Schematic representation of the programmable excision assay. i, Schematic representation of the programmable inversion assay. j, Efficient programmable excision of DNA. Pairs of donor and target are denoted. k, Efficient programmable inversion of DNA. Pairs of donor and target are denoted. In j,k, negative control (NC) expresses the reporter and recombinase but no bridge RNA; and data are MFI ± s.d. of three biological replicates.

