Figure 5.
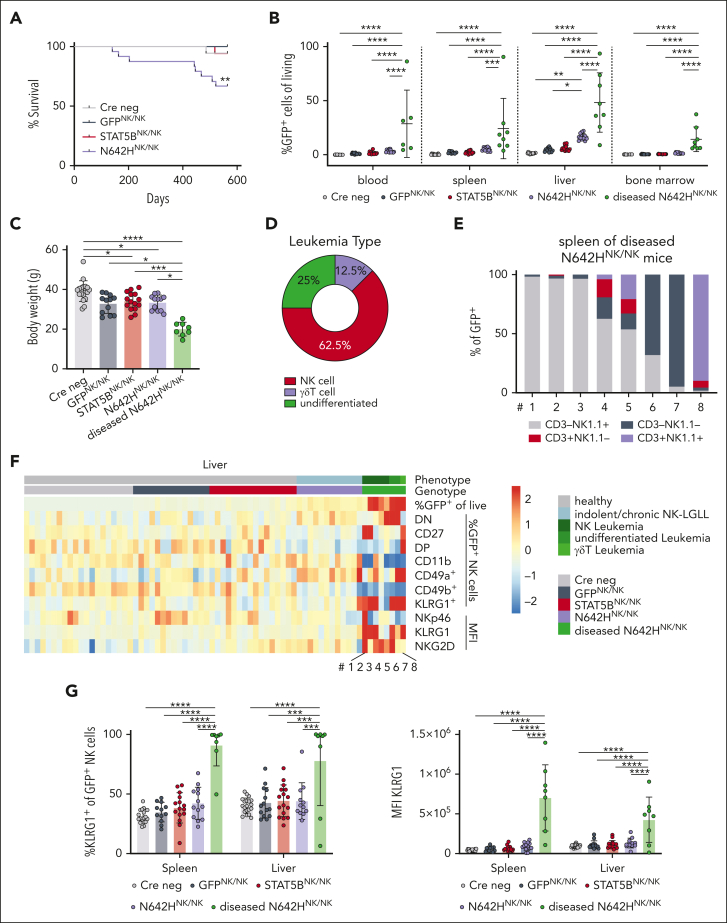
STAT5BN642H induces NK-cell leukemia in mice. Cre neg, GFPNK/NK, STAT5BNK/NK, and N642HNK/NK mice were aged and monitored for signs of disease development. (A) Survival analysis of Cre neg, GFPNK/NK, STAT5BNK/NK, and N642HNK/NK mice (n ≥ 12 per genotype). (B) Flow cytometric analysis of GFP+ cells in different tissues of Cre neg, GFPNK/NK, STAT5BNK/NK, nondiseased N642HNK/NK, and diseased N642HNK/NK mice (n ≥ 8 per group; mean ± standard deviation [SD]). (C) Body weight quantification of Cre neg, GFPNK/NK, STAT5BNK/NK, nondiseased N642HNK/NK, and diseased N642HNK/NK mice (n ≥ 8 per group; mean ± SD). (D) Quantification of the leukemia type developed by N642HNK/NK mice. (E) Relative quantification of CD3+NK1.1– T cells, CD3+NK1.1+ NKT cells, CD3–NK1.1+ NK cells and CD3–NK1.1– “undifferentiated” cells among GFP+ cells in the spleen of diseased N642HNK/NK mice (n = 8). (F) Flow cytometric analysis of GFP+ cells in the liver of Cre neg, GFPNK/NK, STAT5BNK/NK, nondiseased N642HNK/NK, and diseased N642HNK/NK mice (n ≥ 8 per group; mean ± SD). Heat map depicts percentage of GFP+ cells out of living cells, percentages of double-negative (DN; CD27–CD11b–), CD27+, double-positive (DP; CD27+CD11b+), CD11b+, CD49a+, CD49b+, and KLRG1+ cells out of GFP+ NK cells (CD3–NK1.1+) and median fluorescence intensity (MFI) of NKp46, KLRG1, and NKG2D on GFP+ NK cells. (G) Percentages of KLRG1+ (left) and MFI (right) of KLRG1 on GFP+ NK cells in the spleen and liver of Cre neg, GFPNK/NK, STAT5BNK/NK, nondiseased N642HNK/NK, and diseased N642HNK/NK mice (n ≥ 8 per group; mean ± SD). Levels of significance were calculated using the Mantel-Cox test (A) and the 1-way analysis of variance (B-C and G). ∗P < .05; ∗∗P < .01; ∗∗∗P < .001; ∗∗∗∗P < .0001.

