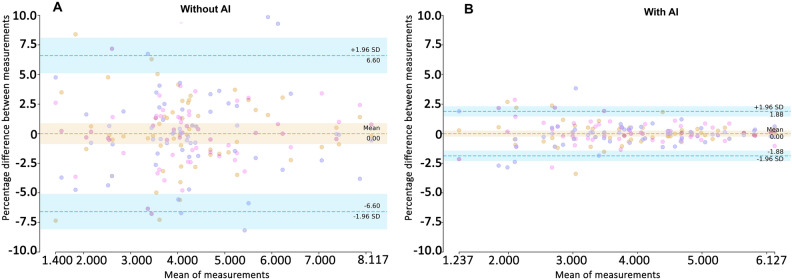
Figure 3.
Plot of scan-rescan agreement in RFCSA. (A) Without AI. (B) With AI. Horizontal dotted lines indicate the limits of agreement from the mean (LoA) of the three measurements. Some symbols are superimposed. The percentage differences of all measurements with the mean (y-axis) are plotted against the mean RFCSA for all participants (x-axis). The horizontal dashed lines indicate the limits of agreement with the mean of the three repeated measurements and ranged from −6.6 to 6.6% for the non-AI group and −1.9 to 1.9% for the AI group.

