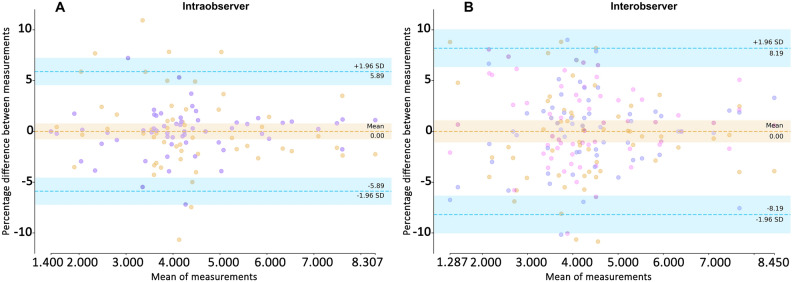
Figure 4.
Intraobserver and Interobservers agreement plots of RFCSA measurements: (A) of the same operator over time and (B) interobserver agreement plot between 3 observers. Observers represent different symbols. The percentage differences of all measurements with the mean (y-axis) are plotted against the mean RFCSA for all participants (x-axis). The horizontal dashed lines indicate the limits of agreement with the mean of the three observers and ranged from −5.9 to 5.9% for interobserver (left) and from −8.2 to 8.2% for interobserver (right).

