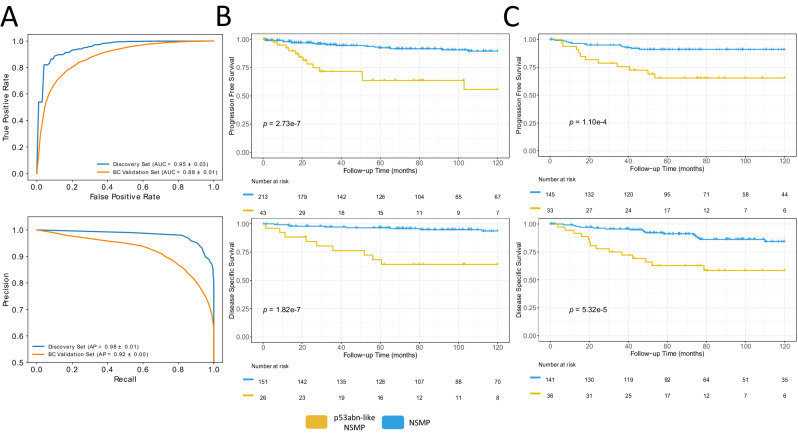
Fig. 2. Performance statistics and Kaplan Meier (KM) survival curves for AI-identified EC subtypes.
A AUROC and precision-recall plots of average of 10 splits for p53abn vs. NSMP classifier for discovery and validation sets, (B) KM curves associated with PFS and DSS (where available) for the discovery set, using a two-sided log-rank statistical test, (C) KM curves associated with PFS and DSS (where available) in the BC validation set, using a two-sided log-rank statistical test (Source data are provided as a Source Data file).

