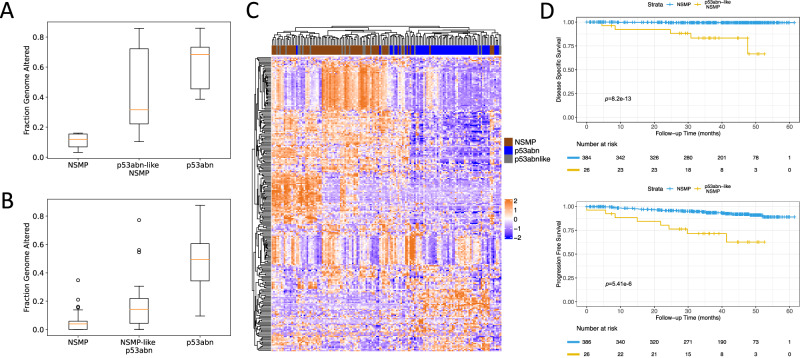
Fig. 4. Molecular profiling of p53abn-like NSMP cases.
Boxplots of copy number burden (i.e., fraction genome altered) in NSMP, p53abn-like NSMP, and p53abn cases in the (A) BC validation cohort (6 NSMP, 7 p53abn-like NSMP, 5 p53abn) and (B) TCGA (69 NSMP, 21 p53abn-like NSMP, 56 p53abn) cohorts. In box plots in A and B, the central line represents the median, while the bottom and top edges of the box correspond to the 25th and 75th percentiles, respectively. The whiskers extend to the most extreme data points that are not identified as outliers. Any data points beyond the lower and upper whiskers are considered outliers. C Gene expression profiles associated with the p53abn-like NSMP (n = 21), NSMP (n = 69), and p53abn (n = 56) tumors in the TCGA cohort. D KM curves associated with PFS and DSS (where available) in the CC validation set (Source data are provided as a Source Data file).

