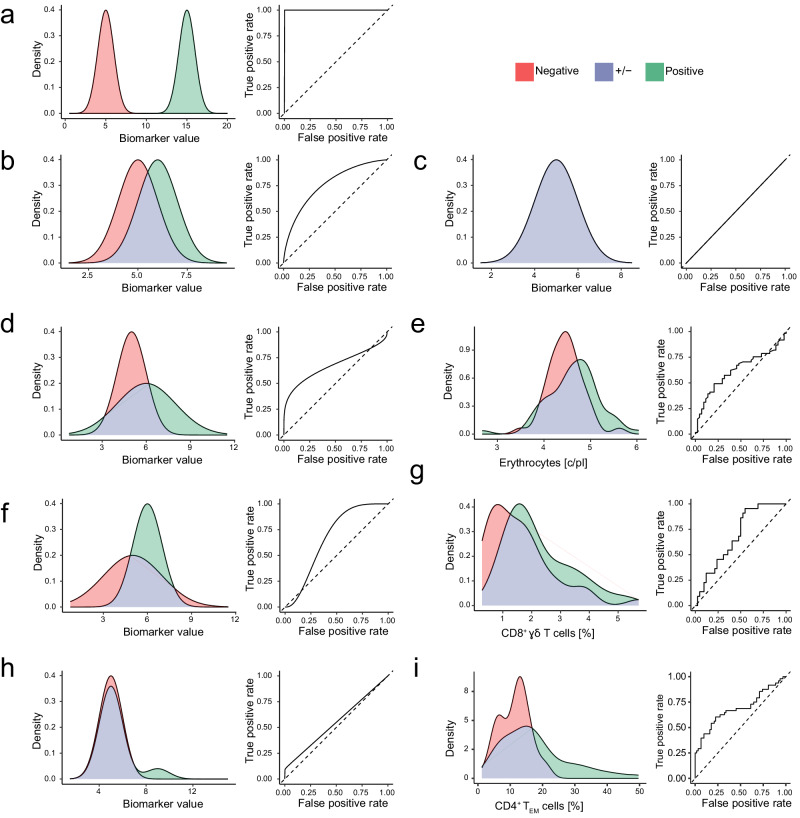
Fig. 1. Two-class distributions resulting in asymmetric ROC curves.
We present hypothetical and real-world examples of biomarker distributions in two classes that represent sets of patients with different clinical outcomes. The distribution of values from the positive (i.e. diseased) class is coloured green, and the negative (i.e. control) class is coloured red. Overlapping densities are coloured purple. For each example, we present the corresponding ROC curve. a A hypothetical example of a perfectly discriminatory biomarker with negative and positive populations that give rise to a symmetrical ROC curve. The area under the ROC curve (AUC) is 1.0. b A hypothetical example of substantially overlapping biomarker distributions in the negative and positive populations that give rise to a symmetrical ROC curve with AUC = 0.76. c A hypothetical example of an uninformative biomarker distribution with negative and positive populations that give rise to a diagonal ROC curve with AUC = 0.5. d A hypothetical example of substantially overlapping biomarker distributions in the negative and positive populations with unequal variance that gives rise to right-skewed ROC curve with AUC = 0.67. e A real-world example of substantially overlapping distributions of absolute erythrocyte counts with unequal variance in patients with metastatic melanoma who responded (n = 61) or did not respond (n = 44) to combined Ipi-Nivo therapy. We observe a right-skewed ROC curve with AUC = 0.62. f A hypothetical example of substantially overlapping biomarker distributions in the negative and positive populations with unequal variance that gives rise to a left-skewed ROC curve with AUC = 0.67. g A real-world example of substantially overlapping distributions of CD8+ γδ T cells with unequal variance in patients with metastatic melanoma who did (n = 22) or did not (n = 42) develop treatment-related hepatitis after Ipi-Nivo therapy. We observe a left-skewed ROC curve with AUC = 0.69. h A hypothetical example of substantially overlapping biomarker distributions in the normally distributed negative and bimodally distributed positive populations. In this example, the positive population comprises 10% cases with elevated biomarker expression and 90% cases with unaltered biomarker expression . Heterogeneity in the diseased cases gives rise to a right-skewed ROC curve with AUC = 0.55. i A real-world example of a phenotypically heterogeneous set of patients with metastatic melanoma who did (n = 48) or did not (n = 62) develop treatment-related hepatitis after Ipi-Nivo therapy. A subset of these patients exhibited a baseline expansion of CD4+ TEM cells that was likely driven by subclinical cytomegalovirus (CMV) reactivation. Consequently, CD4+ TEM cell frequency before therapy is a weakly discriminatory biomarker of hepatitis risk that gives rise to a right-skewed ROC curve with AUC = 0.64.

