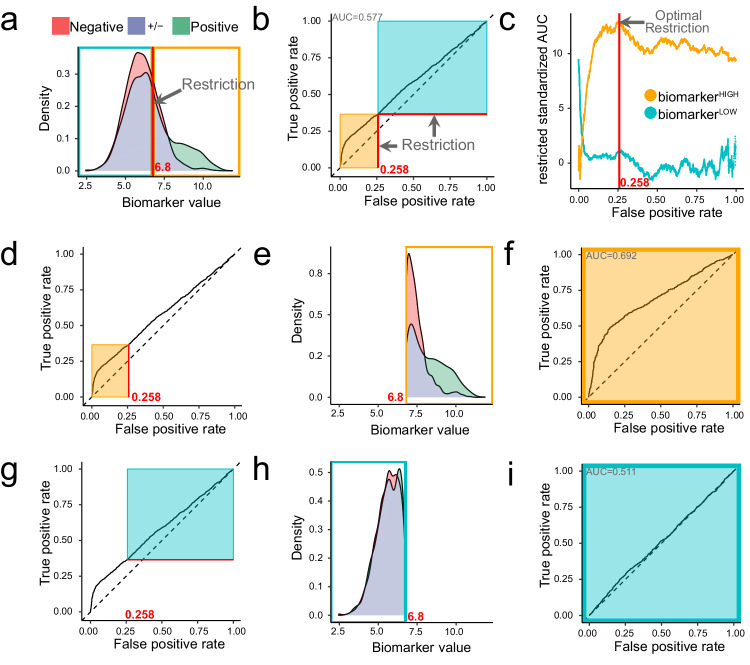
Fig. 2. Method to optimally restrict datasets to classifiable samples.
We present a simulated example of biomarker distributions in two classes that represent sets of patients with different clinical outcomes. a The distribution of values from the positive (n = 2500) class are coloured green and values from the negative (n = 2500) class are coloured red; the overlapping density areas are coloured purple. In this example, 20% of positive samples and 2% of negative samples were drawn from a population with elevated biomarker expression . All other samples were drawn from a population with unaltered biomarker expression . The optimal restriction of this dataset lies at a biomarker value of 6.8, which is marked with a red line. Restriction of the dataset defines two subsets of samples: biomarkerHIGH (orange) and biomarkerLOW (blue) samples. b A complete ROC curve marked at the optimal restriction point (red lines) corresponding to FPR = 0.258. Restricting the ROC curve corresponding to biomarkerHIGH or biomarkerLOW samples gives us restricted ROC curves for which restricted AUCs (rAUCs) are calculated. c Adjusting the rAUC for the number of samples delimited by the restriction gives the restricted standardised AUC (rzAUC) that can be plotted for biomarkerHIGH and biomarkerLOW samples at all possible restriction values. The optimal restriction value is defined as the maximum absolute rzAUC for either the biomarkerHIGH or biomarkerLOW samples. d A complete ROC curve to illustrate the delimitation of biomarkerHIGH values (orange rectangle) according to the optimal restriction. e Densities of the negative and positive classes after restriction to biomarkerHIGH values. f ROC curve constructed from biomarkerHIGH samples. g A complete ROC curve to illustrate the delimitation of biomarkerLOW values (blue rectangle) according to the optimal restriction. h Densities of the negative and positive classes after restriction to biomarkerLOW values. i ROC curve constructed from biomarkerLOW samples.

