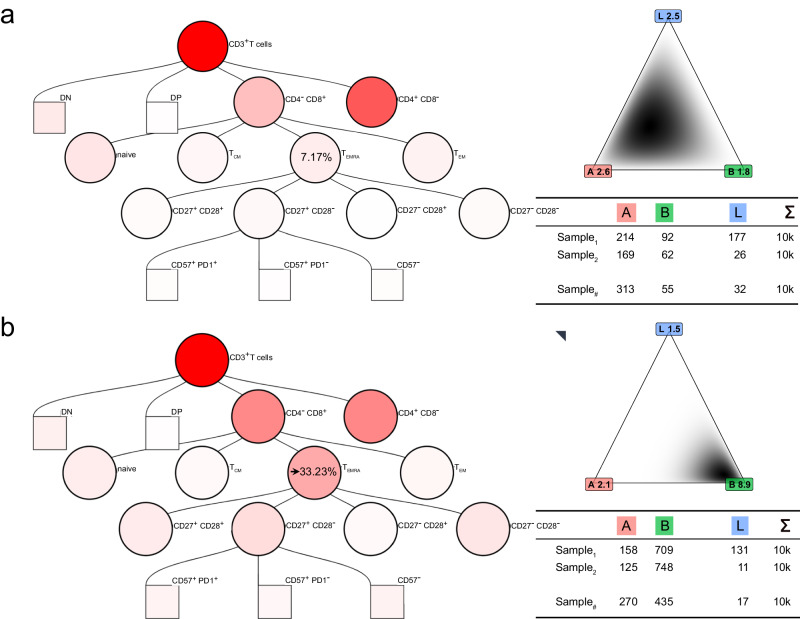
Fig. 4. Realistically synthesising flow cytometry data from two class distributions.
Various applications of our synthetic flow cytometry data depend upon generating samples with differences in cell subset distributions. Here, we provide an example of increasing the proportion of CD8+ TEMRA cells in synthetic samples from a baseline value of 7.17% in the negative class to an altered value of 33.23% in the positive class. The intensity of red shading in the gating trees illustrates this change in CD8+ TEMRA cells and contingent changes in other populations. a Gating tree with 7.17% CD8+ TEMRA cells and the density for three example gates: A, B and L. The cell count table for three samples drawn from this distribution is shown. b Gating tree with 33.23% CD8+ TEMRA cells and the density for three example gates: A, B and L. The cell count table for three samples drawn from this distribution is shown. Of special note, percentages of cells in all other gates also changed according to the Dirichlet distribution, leading to changes in simulated cell counts across all leaf gates.

