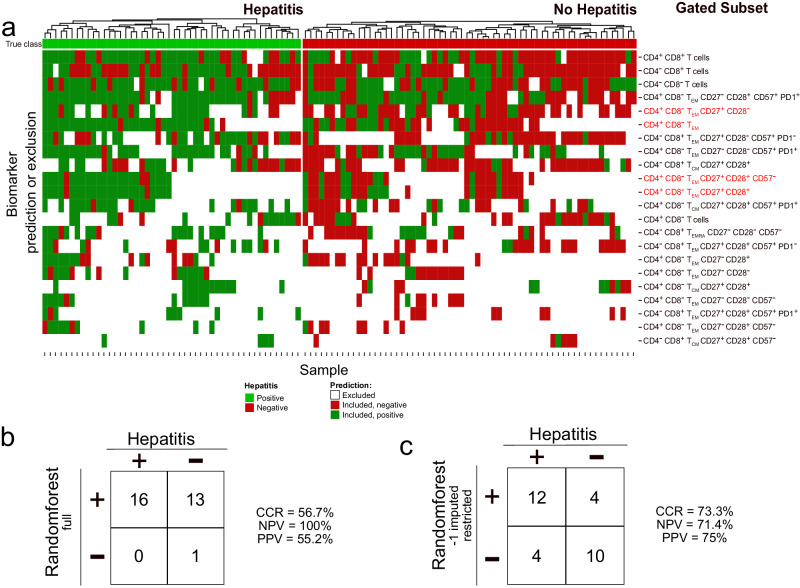
Fig. 8. Significant biomarkers according to classical and our analysis predicting hepatitis.
a Heatmap showing significant biomarkers of hepatitis risk after Ipi-Nivo therapy based upon permutation p-values for unrestricted and restricted AUC. After correction for multiple testing, only 4 biomarkers remained significant, all discovered by our restriction method and indicated by red text. Each further column reflects one sample, each row a biomarker. The samples are grouped into patients who did (green) or did not (red) develop treatment-related hepatitis, shown in the very first row. The main matrix consists of three values: Those excluded according to restriction (white); those included and predicted positive (dark green); and those included and predicted negative (dark red). Columns were clustered, rows in increasing order according to the number of excluded samples. b Random forest predictions and performances on the prospective validation cohort (n = 30) trained on all, not only the significant, unrestricted biomarker values from the 110 training samples. c Random forest model predictions and performances on the prospective validation cohort (n = 30) trained on all, not only the significant, restricted biomarker values from the 110 training samples. Biomarker values that fell outside the informative range were replaced with −1 before training and application of the random forest. Our restriction method was used to establish the informative range for every biomarker using only training set samples.

