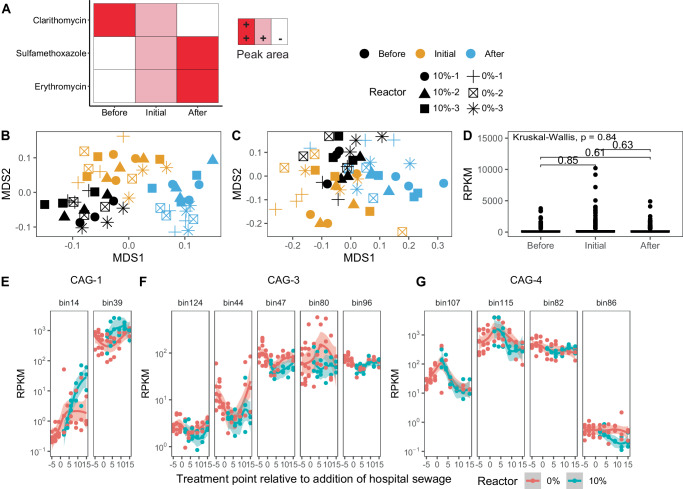
Fig. 5. Hosts of macrolide and sulfonamide resistance genes vary in trajectory in the presence of fluctuating levels of the corresponding antibiotics.
A Overview of the patterns in peak areas of identified antibiotics before, initially after, and 2 weeks after introduction of hospital sewage, as detailed in Fig. 4H–K. B NMDS of all bin relative abundances across time. C Same as (B) but subset to only include bins with macrolide or sulfonamide resistance genes. D Boxplot of relative abundance of bins bearing macrolide or sulfonamide resistance genes. Numeric values and bars represent Wilcoxon-rank sum p-values and comparisons, respectively. Individual points represent samples taken from biological replicate reactors (n = 6 per sampling point). All boxplot summary statistics are: center line: median; upper/lower hinges: 75th and 25th percentiles, respectively; upper and lower whiskers represents the data points extending from the hinge to at most 1.5 times the interquartile range. E–G Relative abundances of different hosts of macrolide or sulfonamide resistance genes partitioned by coabundance group (CAG). E CAG-1 relative abundances over the course of the experiment. F CAG-3 relative abundances. G CAG-4 relative abundances. Before: up to five days before the addition of hospital sewage; initial: the first few days following addition of hospital sewage; after: the last five days of the experiment following addition of hospital sewage. 5B–G: Source data are provided as a Source Data file.

