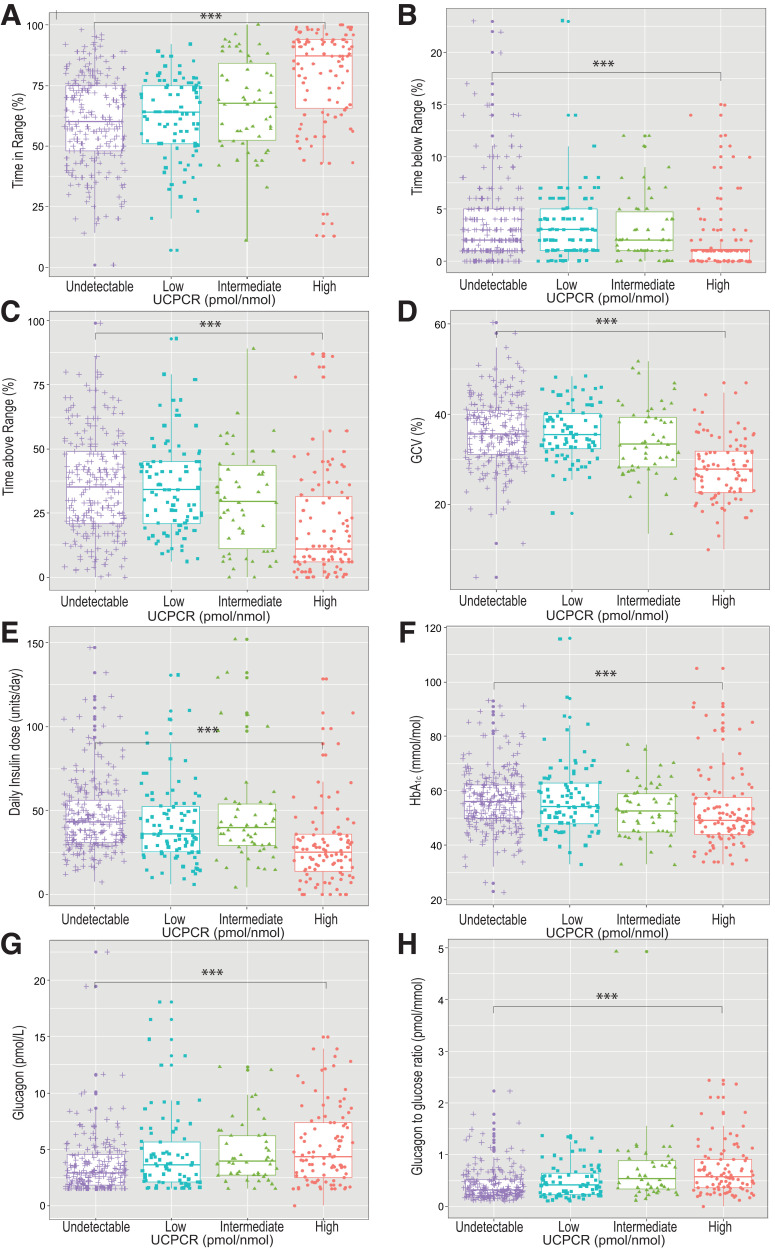
Figure 2.
Box plot visualization of residual β-cell function by categories of UCPCR and TIR (A), TBR (B), TAR (C), glucose CV (GCV) (D), total daily insulin dose (E), HbA1c (F), glucagon (G), and glucagon/glucose ratio (H) (16). UCPCR values are defined as undetectable (<0.01 nmol/mmol), low (0.01–0.2 nmol/mmol), intermediate (0.2–0.6 nmol/mmol), and high (>0.6 nmol/mmol).

