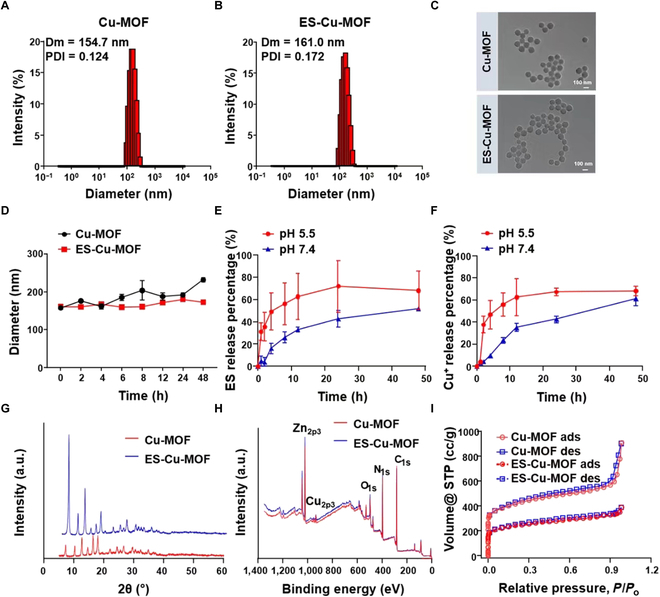
Fig. 2.

The characterization of Cu-MOF and ES-Cu-MOF nanoplatform. (A and B) Hydrodynamic diameter and zeta potential of Cu-MOF and ES-Cu-MOF. (C) TEM images of Cu-MOF and ES-Cu-MOF. (D) Size change curves of Cu-MOF and ES-Cu-MOF incubated with 1 × PBS over time. (E and F) Cumulative release profiles of ES and Cu2+ from ES-Cu-MOF at different pH conditions (7.4 and 5.5). (G) XRD patterns of Cu-MOF and ES-Cu-MOF. (H) XPS spectra of Cu-MOF and ES-Cu-MOF. (I) Absorption properties of Cu-MOF and ES-Cu-MOF were measured with N2 adsorption–desorption analysis. Data presented as mean ± SEM.
