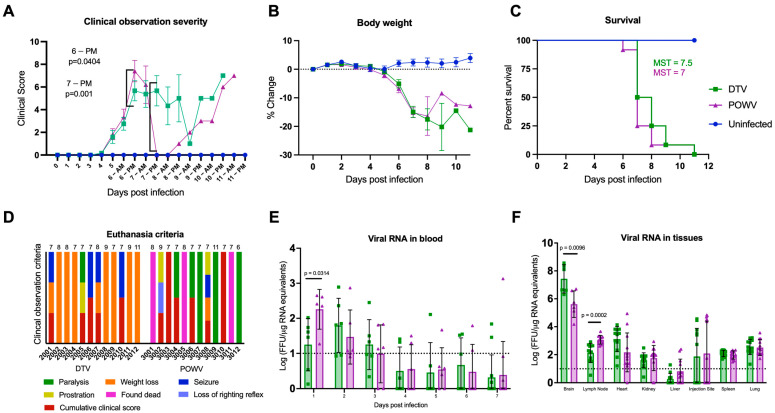
Figure 1.
Clinical presentation of DTV and POWV infections. Mice (n = 12 per group) were inoculated via the footpad with 103 FFU of media (blue circles), DTV (green squares), or POWV (purple triangles) and monitored for signs of disease for up to 11 dpi. (A) Clinical signs of disease were categorized and scored by severity (Table S1). Significant differences in DTV and POWV mice clinical scores occurred at the PM observations on 6 dpi and 7 dpi. (B) Percent weight change from pre-infection. Comparisons on (A,B) were made using one-way ANOVA with Šίdάk multiple comparisons test. Error bars indicate SEM. (C) Survival of mice across all treatments were evaluated using the Mantel–Cox log-rank test and median survival times (MST) were calculated. (D) Humane euthanasia was performed when mice met specific criteria. The cause(s) of mortality were summarized for each animal to demonstrate differences between DTV and POWV. Each colorized bar indicates the reason(s) for euthanasia. The numbers above the bars indicate the day of euthanasia post-infection. (E,F) Blood was collected from alternating cohorts of male (n = 3) and female (n = 3) mice from 0 to 7 dpi and at termination blood and tissues (brain, popliteal lymph node, heart, kidney, liver, injection site, spleen, and lung) were collected from all animals to determine viral loads via rt-qPCR. For brain analysis, six animals per group (3M and 3F) were tested and for all other tissues twelve animals (6M and 6F) were tested. Viral loads are expressed as Log FFU equivalents per microgram of RNA after normalization to a standard curve. Comparisons on (D,E) were performed using two-tailed Student’s t-test with Welch’s correction. For statistically significant comparisons, p-values are provided on the figure panels.

