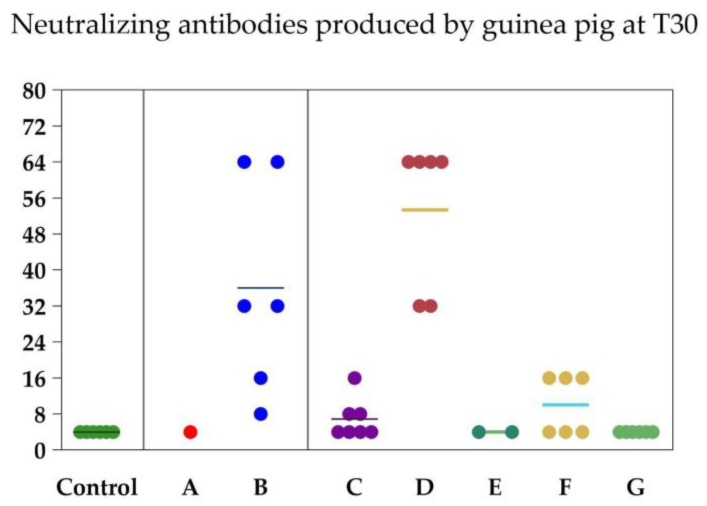
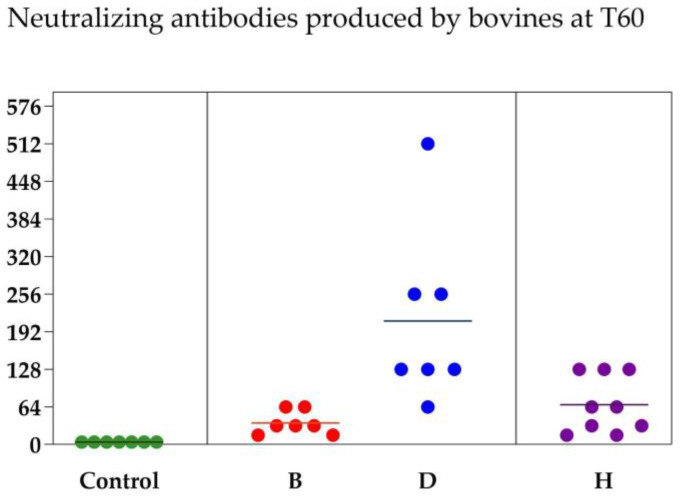
Figure 2.
Neutralizing antibodies produced by each of the guinea pigs at T30 and by each of the cattle at T60 according to each vaccine formulation. Each circle represents an animal and each color represents a vaccine group (control, vaccine B, vaccine D and vaccine H). The marker means the average between groups.


