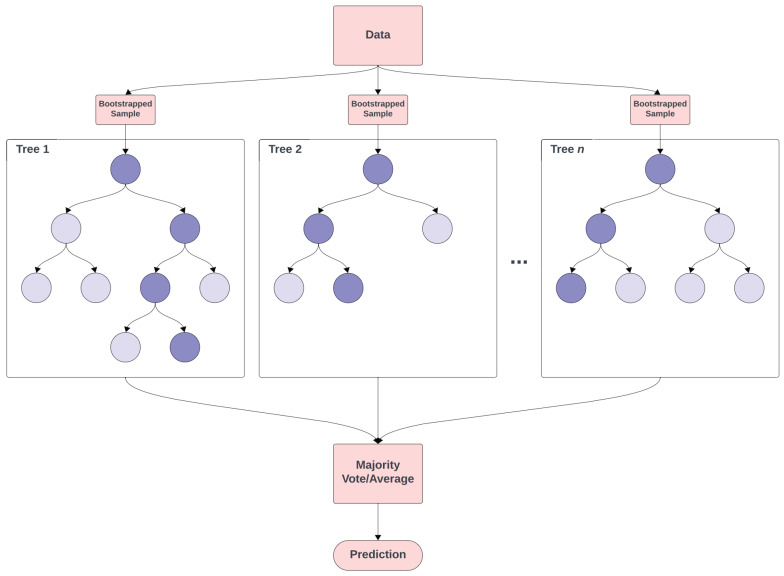
Figure 6.
The random forest algorithm constructs an ensemble of decision trees, with each tree built from a unique bootstrapped sample of the original dataset. Nodes are colored light blue to represent the regular decision nodes of the trees. Distinct paths through each tree are shown, highlighted by the darker blue nodes, and represent a sequence of decisions made from the root to a leaf node based on the input features. The final prediction of the random forest is determined by aggregating the predictions of all trees, using majority voting for classification tasks or mean prediction for regression tasks.

