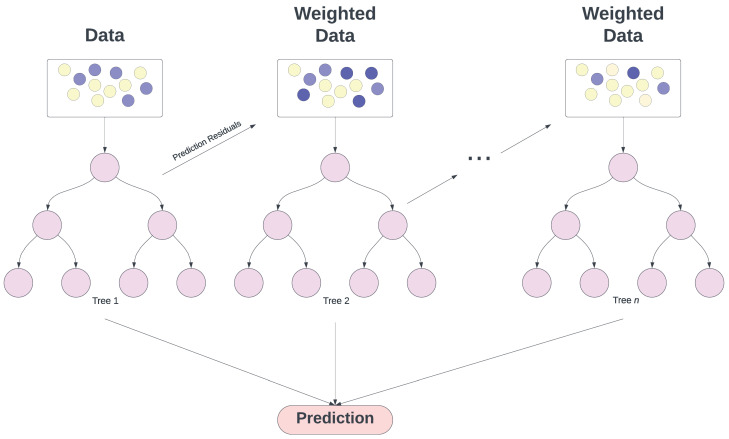
Figure 7.
Gradient boosting process. Here, the weak learners are trees that are trained sequentially on weighted data with iteratively adjusted weights based on previous prediction errors. The light yellow circles represent data points with lower residuals (errors), the light blue circles represent data points with moderate residuals, and the dark blue circles represent data points with higher residuals from previous model predictions. The pink circles within the trees indicate the decision nodes of each weak learner. The final prediction is made by aggregating the outputs from all weak learners.

