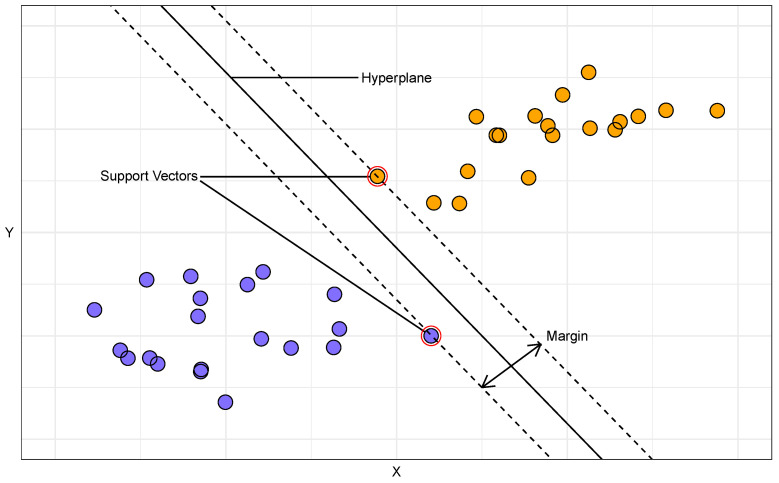
Figure 8.
Support vector machine process. The diagram illustrates the SVM’s method of finding the optimal hyperplane that maximises the margin between two classes, depicted by the blue and orange points. The support vectors, which are the data points closest to the decision boundary, define the margin.

