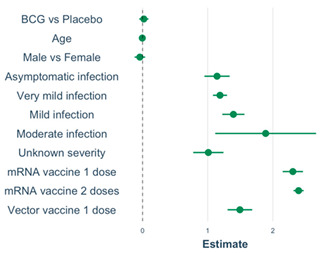
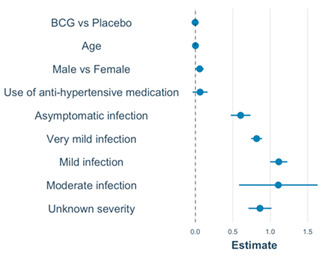
Table 3.
Multivariable models with M12 anti-S1 and anti-N log10 concentrations as outcome.
| Model: M12 Anti-S1 6,7 | Covariate | Estimate (95% CI) | Exp 4 (Estimate) (95% CI) | p | VIF 5 | |
| Model intercept 1 | 0.50; (0.36, 0.64) | 3.02; (2.19, 4.17) | <0.001 |

|
||
| BCG vs. placebo 2 | 0.02; (−0.05, 0.09) | 1.05; (0.89, 1.23) | 0.585 | 1.01 | ||
| Age (per year) | −0.004; (−0.01, −0.007) | 0.99; (0.98, 0.99) | 0.008 | 1.04 | ||
| Male sex | −0.04; (−0.12, 0.04) | 0.91; (0.76, 1.10) | 0.311 | 1.01 | ||
| All the below compared to participants who never had an infection or vaccination during follow-up: | ||||||
| Asymptomatic | 1.14; (0.95, 1.34) | 14.13; (8.91, 21.88) | <0.001 | 1.01 | ||
| Very mild | 1.19; (1.08, 1.30) | 16.22; (12.59, 20.42) | <0.001 | 1.02 | ||
| Mild | 1.39; (1.22, 1.56) | 25.12; (16.98, 38.02) | <0.001 | 1.02 | ||
| Moderate | 1.89 (1.12, 2.66) | 74.13; (12.30, 446.68) | <0.001 | 1.01 | ||
| Unknown severity | 1.01; (0.78, 1.24) | 10.96; (6.46, 18.62) | <0.001 | 1.02 | ||
| mRNA 1 dose | 2.31; (2.15, 2.46) | 112.20; (47.86, 263.03) | <0.001 | 1.06 | ||
| mRNA 2 doses | 2.40; (2.32, 2.47) | 245.47; (204.17, 295.12) | <0.001 | 1.06 | ||
| Vector 1 dose | 1.49; (1.31, 1.68) | 223.87; (151.36, 331.13) | <0.001 | 1.06 | ||
| Model : M12 Anti-N 8,9 | Covariate | Estimate (95% CI) | Exp 4 (estimate) | p | VIF 5 | |
| Model intercept 3 | 0.48; (0.39, 0.57) | 2.95; (2.40, 3.63) | <0.001 |

|
||
| BCG vs. placebo 2 | −0.003; (−0.05, 0.04) | 0.99; (0.89, 1.10) | 0.901 | 1.01 | ||
| Age (per year) | 0.001; (−0.007, 0.003) | 1.00; (0.98, 1.01) | 0.312 | 1.06 | ||
| Male sex | 0.06; (0.005, 0.11) | 1.15; (1.01, 1.29) | 0.040 | 1.01 | ||
| Hypertension med | 0.06; (−0.04, 0.16) | 1.15; (0.91, 1.44) | 0.222 | 1.07 | ||
| All the below compared to participants who never had an infection or vaccination during follow-up: | ||||||
| Asymptomatic | 0.60; (0.47, 0.74) | 4.07; (2.95, 5.50) | <0.001 | 1.01 | ||
| Very mild | 0.82; (0.74, 0.89) | 6.61; (5.62, 7.94) | <0.001 | 1.04 | ||
| Mild | 1.11; (1.00, 1.23) | 13.18; (10.0, 16.98) | <0.001 | 1.01 | ||
| Moderate | 1.11; (0.58, 1.63) | 13.48; (4.07, 45.71) | <0.001 | 1.01 | ||
| Unknown severity | 0.86; (0.71, 1.02) | 7.24; (5.13, 10.23) | <0.001 | 1.01 | ||
Abbreviations: BCG = Bacillus Calmette–Guérin vaccine; CI = confidence interval; M = month; VIF = variance of inflation factor. Indicator variables were created, and model building is described in more detail in Supplementary Methods. p-values in bold indicate p < 0.05. 1 The reference is an individual in the placebo group, zero years old, who never had a SARS-CoV2 infection and was never vaccinated for COVID-19. 2 Baseline BCG or placebo vaccination was forced into the models to take the original randomisation into account. Age and sex were forced into the models because of their well-documented effects on immune responses. 3 The reference is a female individual in the placebo group, zero years old, who never experienced a SARS-CoV-2 infection. 4 Antilog 10x of the model estimates. 5 The VIF values for this model are all less than 5, which means that there was no evidence of multicollinearity. 6 The model includes N = 967 participants (three participants with unknown vaccine types dropped out of the model). 7 Therefore, the linear equation is Log10(anti-S1 concentration M12) = 0.50 + 0.02 × BCG + 1.14 × Asymptomatic infection + 1.19 × Very mild infection + 1.39 × Mild infection + 1.89 × Moderate infection + 1.01 × infection with unknown severity + 2.31 × One dose of mRNA + 2.40 × Two doses of mRNA + 1.49×One dose of vector − 0.004 × per year of age −0.04 × Male. 8 The model includes N = 970 participants. 9 Therefore, the linear equation is Log10(anti-N concentration M12) = 0.48 − 0.003 × BCG + 0.60 × Asymptomatic Infection + 0.82 × Very mild infection + 1.11 × Mild infection + 1.11 × Moderate infection + 0.86 × Infection with unknown severity + 0.06 × Male + 0.001×per year of age + 0.06 × Use of anti-hypertensive medication.
