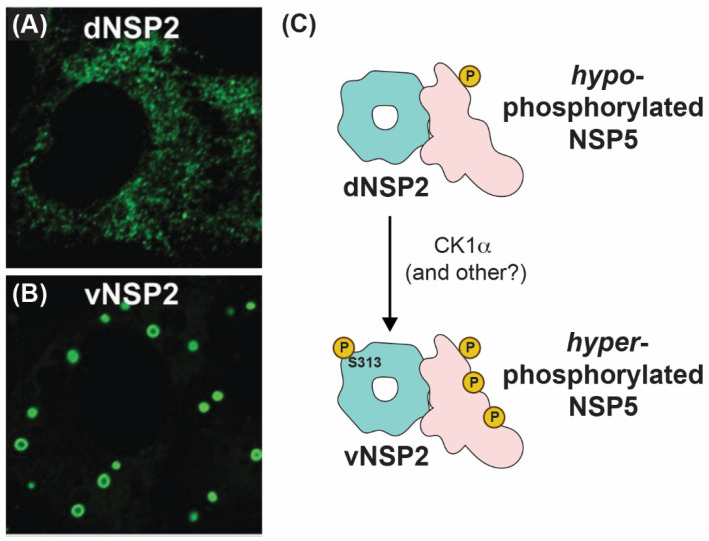
Figure 7.
Intracellular Localizations and Interactions of vNSP2 and dNSP2. Fluorescence confocal micrographs of SA11-infected cells stained with monoclonal antibody against dNSP2 (A) and vNSP2 (B). Images taken from reference [78] with permission. (C) Cartoon model of vNSP2 and dNSP2 phosphorylation status and interactions with NSP5.

