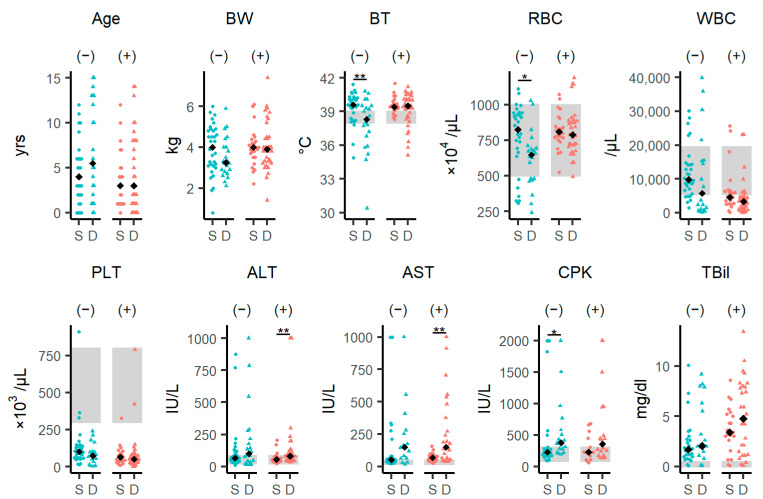
Figure 2.
Differences in clinical characteristics between surviving and dead SFTSV-negative and SFTSV-positive cases. Comparison of individual data and laboratory parameters between the surviving and dead SFTSV-negative and SFTSV-positive groups. The black diamonds represent median values in each group. The blue circles or triangles represent the SFTSV-negative group, and the red circles or triangles represent the SFTSV-positive group. The circles and triangles represent individual values of the surviving group and dead group, respectively. The gray areas represent reference ranges for BT, RBC, WBC, PLT, ALT, AST, CPK, and TBil. The signs “(−)” and “(+)” within the parentheses stand for “SFTSV-negative” and “SFTSV-positive”, respectively. Each variable was compared using the Wilcoxon rank-sum test, and statistical significance levels were corrected using the false-discovery rate (FDR). The level of statistical significance is shown: * p < 0.05, ** p < 0.01. See also Supplementary Tables S3 and S4. Abbreviations: ALT, alanine aminotransferase; AST, aspartate aminotransferase; BT, body temperature; BW, body weight; CPK, creatine phosphokinase; D, died; PLT, platelets; RBC, red blood cells; S, survived; TBil, total bilirubin; WBC, white blood cell(s).

