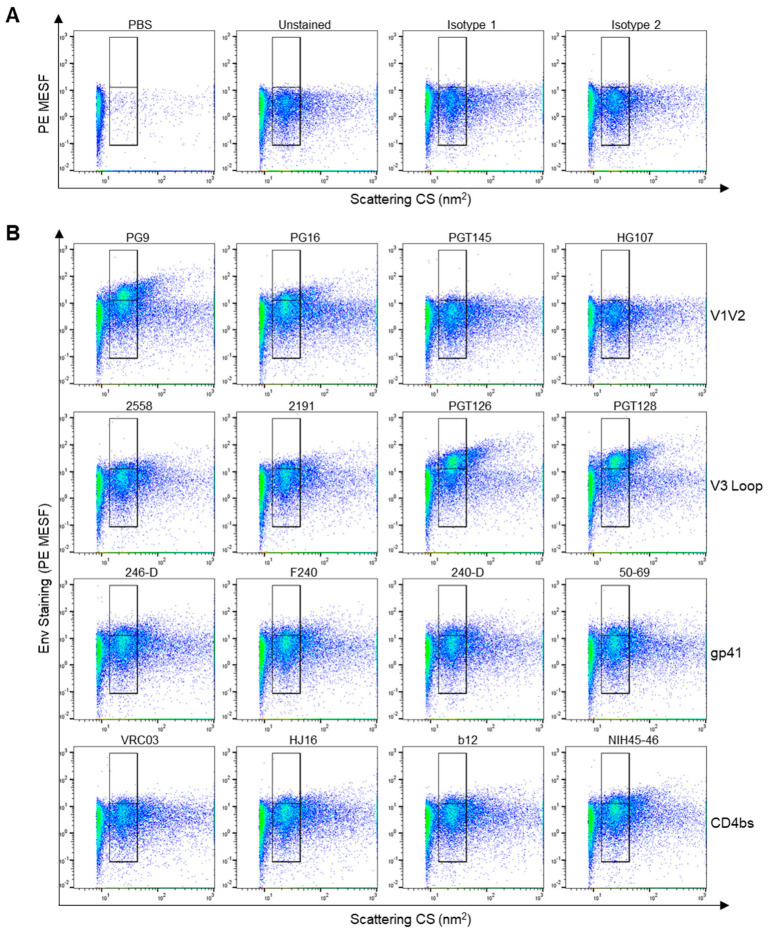
Figure 1.
Anti-Env staining on the HIVIIIB isolate produced in H9 CD4+ T cells. (A) Dot plots displaying flow virometry control stains, including PBS alone, unstained virus, and virus stained with different anti-human isotype control antibodies. Gates are set on the scattering profile (x-axis) of the HIV virus. Positive staining is shown in the upper gate, while background levels are within the lower gate, as determined with isotype controls. (B) Selected antibody staining from quantitative data reported in Table 1, with mAbs targeting the variable loops 1 and 2 (V1V2), V3 loop, gp41 or the CD4bs shown across each row. Representative plots from three independent experiments are shown.

