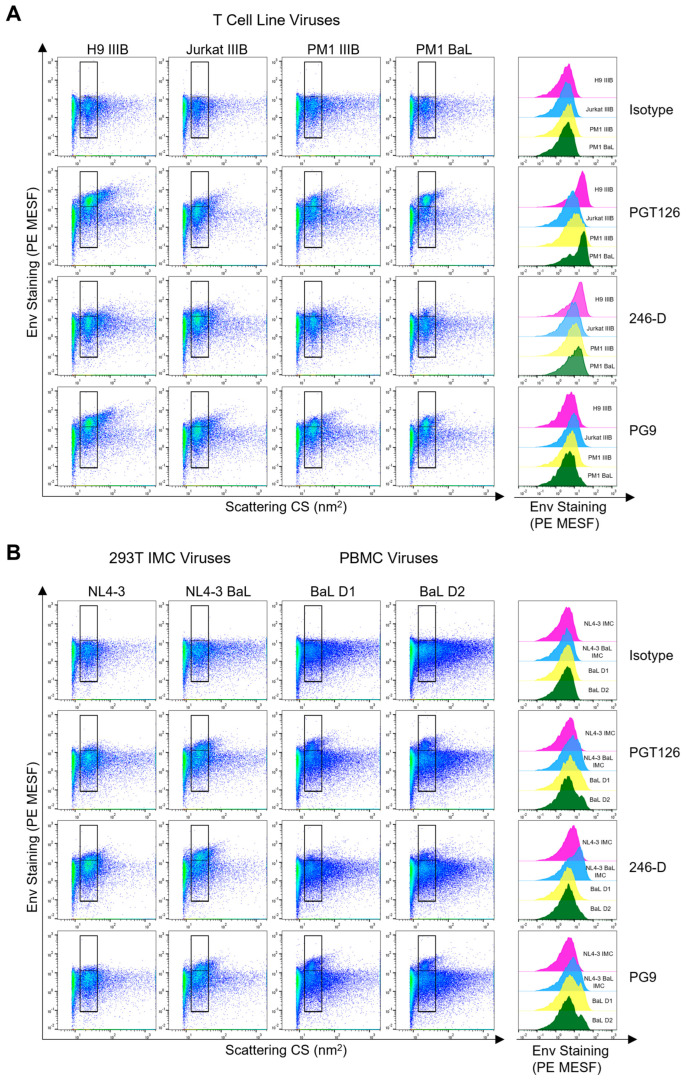
Figure 2.
Comparing Env staining across different cellular models of virus production. (A) Dot plots displaying anti-Env antibody staining (PGT126, 246-D, PG9) of viral isolates (IIIB or BaL, as indicated) produced in the H9, Jurkat, or PM1 cell lines. Positive staining is shown in the upper gate, while background levels as assessed by the isotype control are shown in the lower gate. Histogram overlays displaying the range of Env staining for each virus are shown to the right of the dot plots. The levels of PE-fluorescence represented on histograms are generated from the total virus staining (i.e., spanning the upper and lower gates). (B) In the left two panels, dot plots display anti-Env antibody staining of viruses (NL4-3 and NL4-3 BaL) produced through transfection of infectious molecular clones (IMC) in HEK293T cells. In the two rightmost panels, plots display antibody staining of the HIVBaL isolate produced in PBMC from two different donors (D1 and D2). Representative plots are shown from at least two independent experiments.

