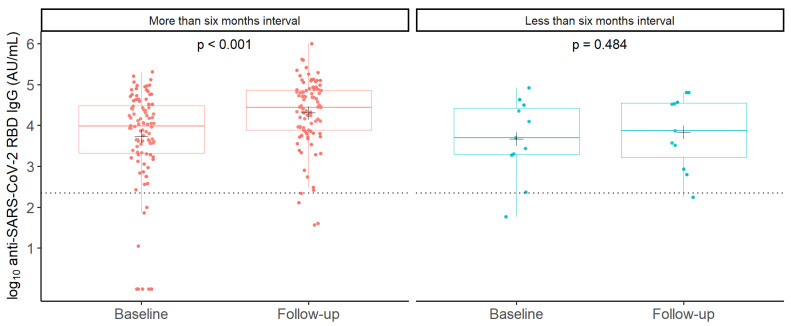
Figure 3.
Observed anti-SARS-CoV-2 RBD IgG concentrations in SOT recipients with intervals between the last two BNT162b2 vaccine booster doses of more and less than six months. Boxplots showing median log10-transformed concentrations of anti-SARS-CoV-2 RBD IgG with interquartile ranges in SOT recipients with more (red) or less (blue) than six months interval between last two doses of BNT162b2 booster vaccine doses, before (baseline) and after (follow-up) receiving the latest booster dose. Each dot represents the observed individual concentration in each sample. Crosses (+) indicate the mean of log10-transformed anti-SARS-CoV-2 RBD IgG concentrations. A paired t-test was used to compare the mean log10-transformed anti-SARS-CoV-2 RBD IgG concentrations at baseline; p-values are printed on the figure. The dashed horizontal line indicates the assay’s minimum threshold for an IgG response.

