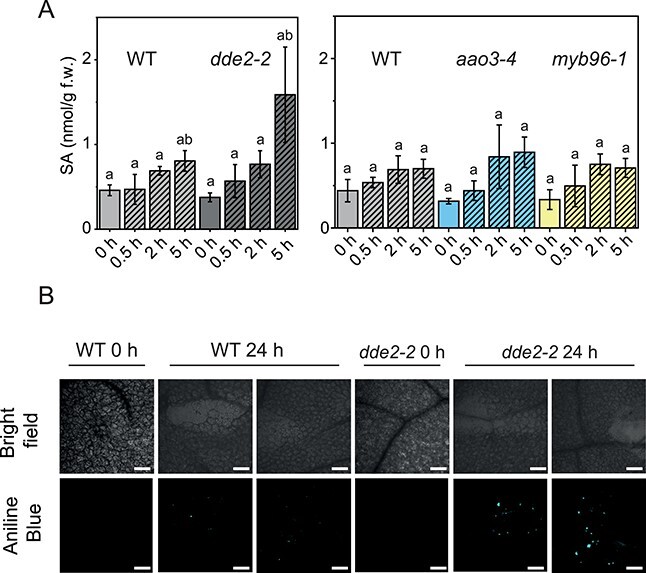
Fig. 4.

Analysis of SA content and callose deposition. (A) SA content in WT, dde2-2, aao3-4 and myb96-1. Values represent means (±SD) of LC-MS/MS analysis of plants harvested from three independent wounding experiments. Alphabetical letters indicate statistical significance determined by ANOVA and Tukey’s post-hoc test (P < 0.05). Data of this figure are available in Supplementary Table S6. (B) Analysis of callose formation in WT and dde2-2 before and 24 h after wounding. Analysis was performed by confocal microscopy, bars: 300 µm.
