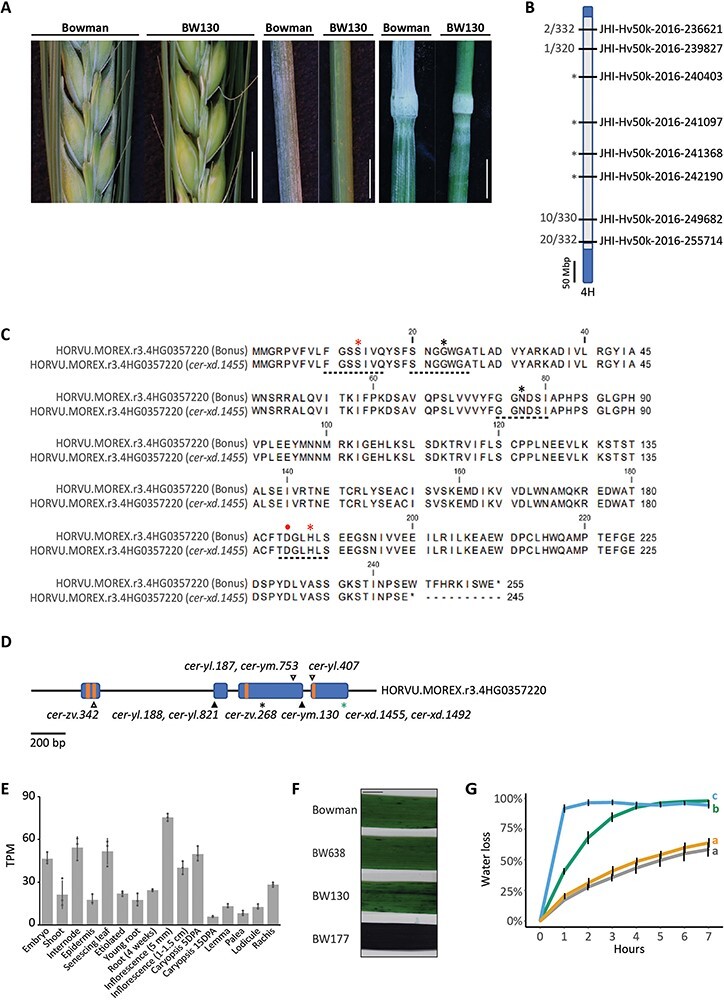
Fig. 1.

Variation in a GDSL esterase/lipase underlies the cer-xd locus in barley. (A) Wax bloom deposition on spikes, leaf sheaths and stems (nodes and internodes) of Bowman and BW130. Scale bars = 5 mm. (B) Representation of chromosome 4H in BW130 showing an introgression from cer-xd.1455 (gray) into Bowman (blue). Labels on right indicate the eight markers on 4H run on the mapping population; labels on left indicate proportion of recombinant gametes. Asterisks indicate markers in complete linkage with the glossy phenotype. (C) Protein alignment of HORVU.MOREX.r3.4HG0357220 in Bonus and cer-xd.1455, showing the premature stop codon removing the last 10 amino acids in the latter. Dotted lines underneath indicate the four GDSL conserved blocks, asterisks indicate the SGNH conserved amino acids, while red asterisks and dot indicate amino acids that form the catalytic triad. (D) HORVU.MOREX.r3.4HG0357220 gene model. Blue boxes represent exons and orange boxes the four GDSL conserved blocks. Variants of cer-yl, cer-ym and cer-zv identified in (Li et al. 2017) are shown in black and the cer-xd variant identified in this manuscript is shown in green. Triangles indicate amino acid substitutions and asterisks indicate premature stop codons. (E) Expression of HORVU.MOREX.r3.4HG0357220 in Morex tissues from the Barley Expression Database (Milne et al. 2021). Data expressed in transcripts per million (TPM). Bars represent mean expression with standard deviation, dots represent biological replicates. (F) Representative images of TB staining of the 2nd leaf of 3-week-old plants. Scale bar = 10 mm. (G) Percentage water loss from the 2nd leaf of 2-week old plants. Lines show average and error bars show standard deviation. Line color indicates genotype: gray, Bowman; green, BW130; blue, BW177; and yellow, BW638. Letters indicate significant differences of the areas under the curves (P = 0.05; Tukey’s HSD multiple comparison following one-way ANOVA), N = 4.
