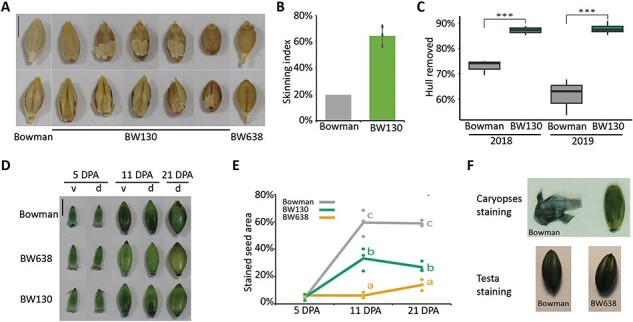
Fig. 2.

Grain features of BW130. (A) Grain skinning in BW130 compared to Bowman (covered grain) and BW638 (nud, naked grain). Scale bar = 5 mm. (B) Skinning index (percentage of seed showing skinning). Bars indicate the average value with standard deviation of three biological replicates (dots) from BW130 or one replicate representing seed from three pooled individuals from Bowman. Over 150 grains inspected per replicate. (C) Box plots show hull removed as percentage of total hull weight in Bowman and BW130 after 15 s of debranning. The lower and upper box represent the first and the third quartiles, the horizontal line indicate the median, the lower and upper whiskers represent the minimal and maximal values within 1.5 times interquartile range. Significant differences following one-way ANOVA (*** = P < 0.001), N ≥ 3. (D) SB staining of Bowman, BW638 and BW130 caryopses; v, ventral and d, dorsal. Scale bar = 5 mm. (E) Percentage of dorsal seed surface area stained by SB, lines represent average and dots represent individual bioreplicates (each bioreplicate is the average of two grains from the same spike). Letters indicate significant differences (P < 0.05; Tukey’s HSD multiple comparison following one-way ANOVA), N = 3, except for 5 DPA BW130, where N = 2. (F) Top panel shows tissue dissection of 11 DPA caryopses of Bowman after staining with SB. Tissue on left is the pericarp dissected off the caryopsis shown on the right. Removal of the pericarp reveals the testa on the caryopsis which is also stained. Bottom panel shows 11 DPA caryopses of Bowman and BW638, where the pericarp was removed to reveal the testa before staining with SB.
