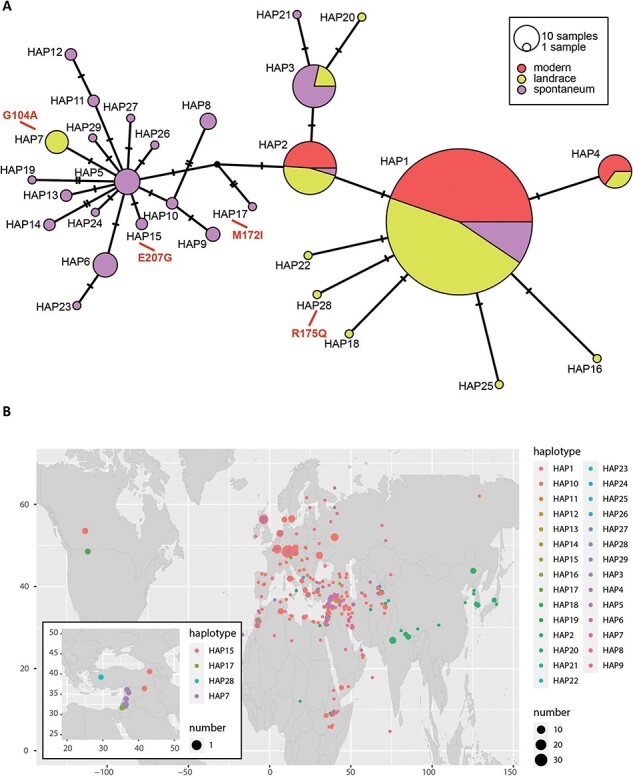
Fig. 6.

Haplotype analysis of HORVU.MOREX.r3.4HG0357220. (A) Median-joining network for HORVU.MOREX.r3.4HG0357220 HAPs. Single-nucleotide polymorphisms (SNPs) were identified comparing HORVU.MOREX.r3.4HG0357220 exonic regions of 477 diverse Hordeum spontaneum (wild barley) and Hordeum vulgare (modern and landraces) accessions. Node size is relative to HAP frequency. Bars between two nodes indicate the number of nucleotides within the sequence that differ between haplotypes. Amino acid changes are shown in red. (B) Haplotype geographical origin distribution. HAPs are distinguished by colors and sizes as described in the legend. Panel inset shows distribution of HAPs with amino acid changes.
