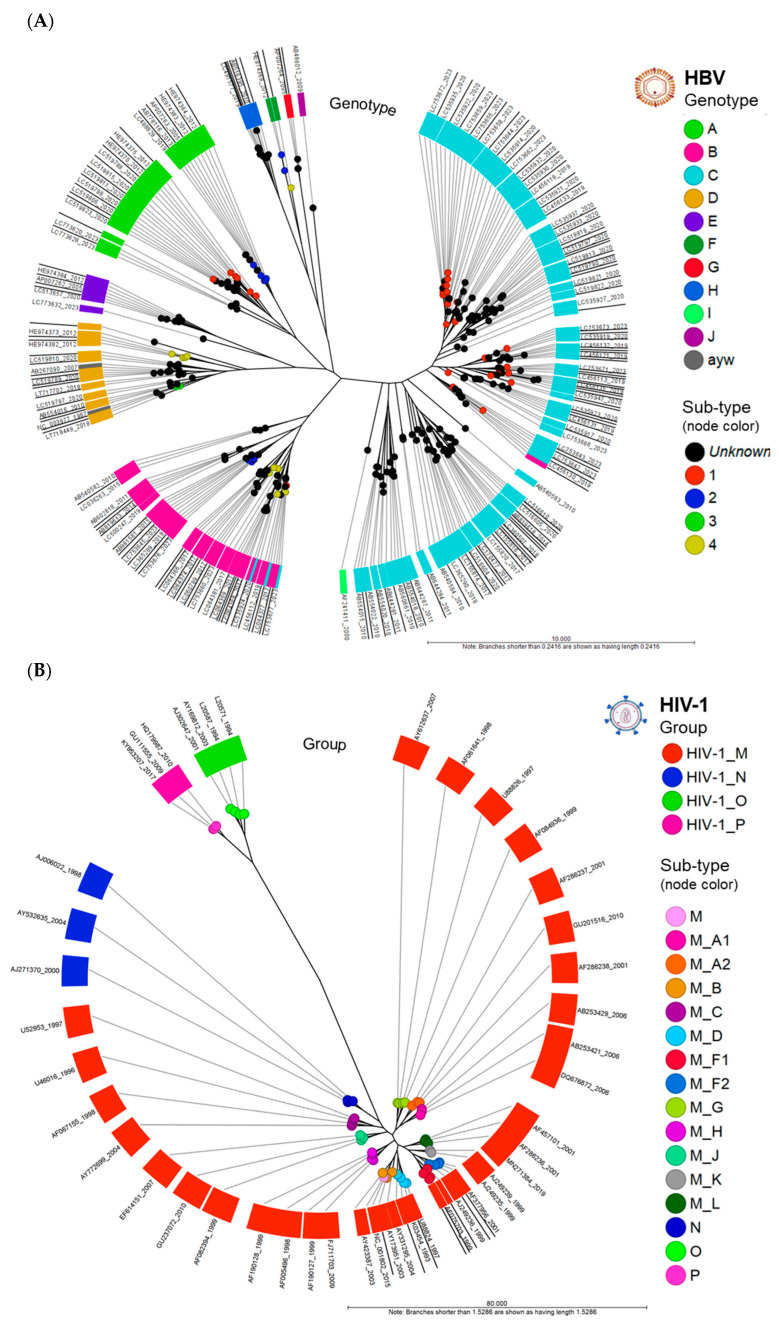
Figure 3.
Circular phylograms of HBV and HIV-1 genomes. (A) Phylogram of aligned HBV whole genomes (n = 268) clustered into 10 genotypes (A–J). The genotypes (clades) and subtypes (nodes) reveal the relatedness of their member samples. Two genomes, NC_003977 (HBV RefSeq) and AB267090, carried the conventional classification by serology (adw, adr, ayw, and ayr) based on HBV surface antigen (HBsAg) reactivity. All genomes clustered according to their assigned genotype except for four accessions found in genotypes B and C (pink/blue discordancy in figure). (B) Phylogram of aligned HIV-1 whole genomes (n = 53) clustered into 4 groups (M–P). All genomes clustered according to their assigned group (clade) and subtype (nodes). The outermost ring (label) displays the NCBI accession number and release date (year).

