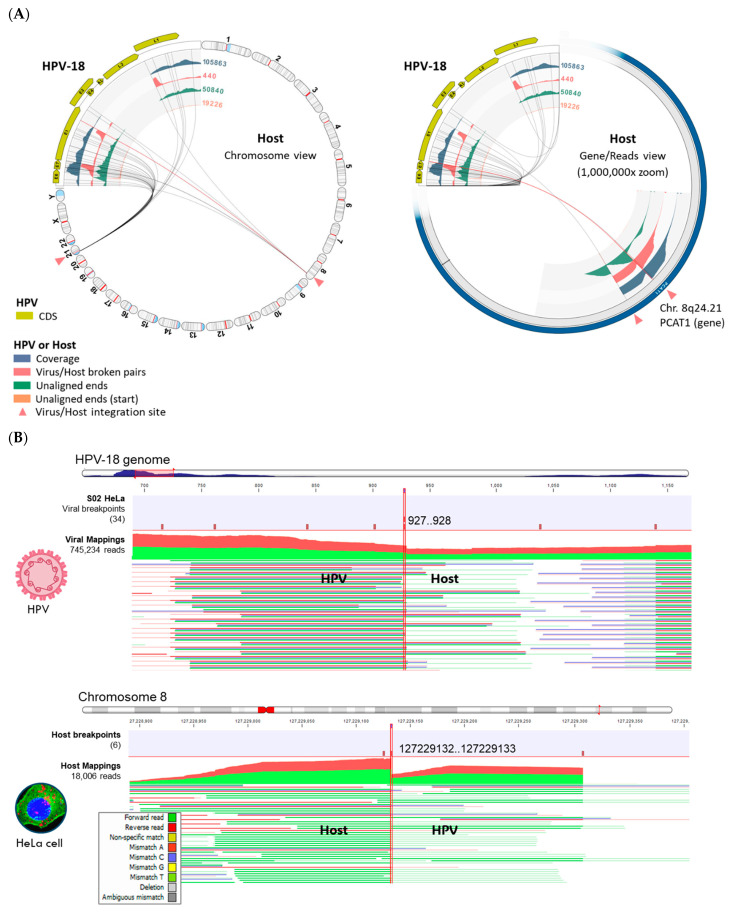
Figure 6.
Viral–Host Integration Site (VIS) analysis of HeLa cells. (A) VIS circular plots in chromosome view (left) and gene view (right) revealed two integration sites at chromosomal cytobands 8p24.21 and 21p11.2. The dynamic functions of the VIS circular plot (i.e., genome rotation and zoom) facilitated rapid inspection of the integration sites. (B) Read mappings to HPV-18 and chromosome 8 at viral or host breakpoints (vertical brown bars with genomic co-ordinates) reveal both forward (green) and reverse (red) viral–host chimeric reads (bolded HPV/Host). The unaligned chimeric segment of a read sequence stands out with its subdued color. Read mappings were truncated due to their extensive length.

