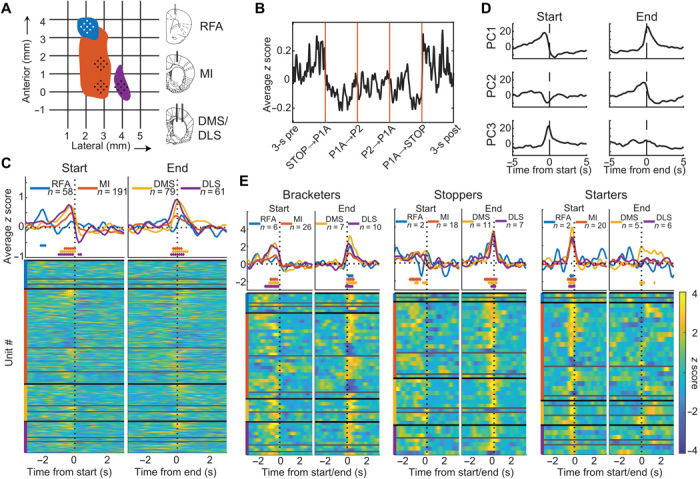
Fig. 2. Modulation of neuronal activity in relation to the onset and end of a grooming sequence.

(A) Recording sites are shown for the right hemisphere. Colored areas in horizontal plane indicate the forelimb representation in primary motor cortex (MI, orange), RFAs (blue), sensorimotor striatum (DLS, purple), and associative striatum (DMS) corresponds to the posterior medial group of electrodes (where DMS is located ventral to the posterior part of MI). (B) Average of z-scored firing rates of recorded units during a specific grooming sequence. The x axis is time warped to align transitions. (C) Top: Average changes in firing rate show a net increase at behavioral transitions into and out of grooming. Bottom: Perievent time histograms (PETHs) for all recorded cells, showing the average standardized rate for each cell, sorted by structure (colored vertical lines), putative cell type (PCs, INs, and unclassified, from top to bottom within each structure), and average z score during significant time bins. The range of Z is indicated by the color bar in (E). (D) Cell firing dynamics represented in the subspace spanned by the first three principal components [of the PETHs shown in (C)], demonstrating symmetry between transitions into and out of grooming. (E) Left: Cells that display significant post-end modulation (bracketers) also show pre-onset modulation. Middle: Cells that show significant pre-end modulation (Stoppers) show minimal bracketing modulation. Right: Cells that show significant pre-onset modulation without significant end modulation (Starters). Note the close resemblance in firing rate modulations between (D) and (E) and that striatum displays a predominant excitation, whereas MI modulation is more balanced, resulting in lower average firing rates. Start, first contact between forepaw and snout; end, first instance of inactivity. Diamonds in (C) and (E) denote individual time bins (125 ms) where the distribution of z-scored firing rates differs significantly from a standard normal distribution (P < 0.001; z test).
