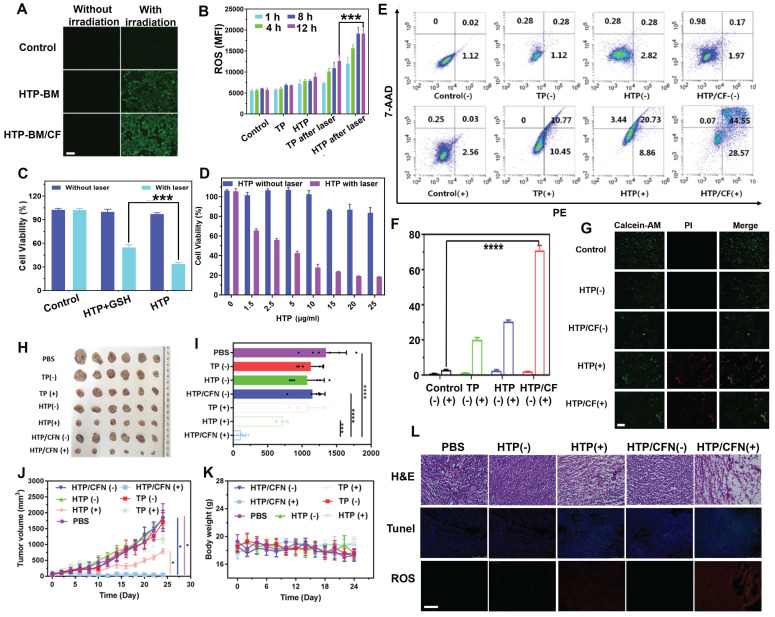
Figure 5.
(A) Intracellular ROS fluorescence imaging after HTP-BM and HTP-BM/CF treatment for 12 h in the presence of laser exposure (660 nm, 1.2 W/cm2, 5 min), (scale bar: 500 µm). (B) Intracellular ROS fluorescence quantification by flow cytometry. (C) 4T1 cells viability incubated with HTP and GSH-treated HTP with or without laser irradiation (660 nm, 1.2 W/cm2, 8 min). (D) 4T1 cells cytotoxicity of HTP along the concentration with and without laser irradiation. (E) Apoptosis using FACS analysis of 4T1 cells treated with various formulations (PBS, TP, HTP, HTP/CF) before and after laser irradiation and (F) its quantitative fluorescence analysis. (G) Live (green) and dead (red) cells fluorescence images of 4T1 cells after incubation with HTP and HTP/CF with and without laser irradiation (660 nm, 1.2 W/cm2), (scale bar: 20 μm). (H) Tumor tissues image of mice extracted after 21 days of treatment with various formulations. (I) Tumor weight statistics of each group after 21 days of treatment. (J) Curves of tumor volume after different treatment with various formulations. (K) Changes in body weight of mice after treatment with different formulations (scale bar:100 µm). (L) Histological and immunohistochemical analysis of tumor sections collected from different treatment groups (scale bar:100 µm). Where (+) represents laser irradiation and (-) represents without laser irradiation. (* p<0.05, *** p<0.001, and **** p<0.0001)

