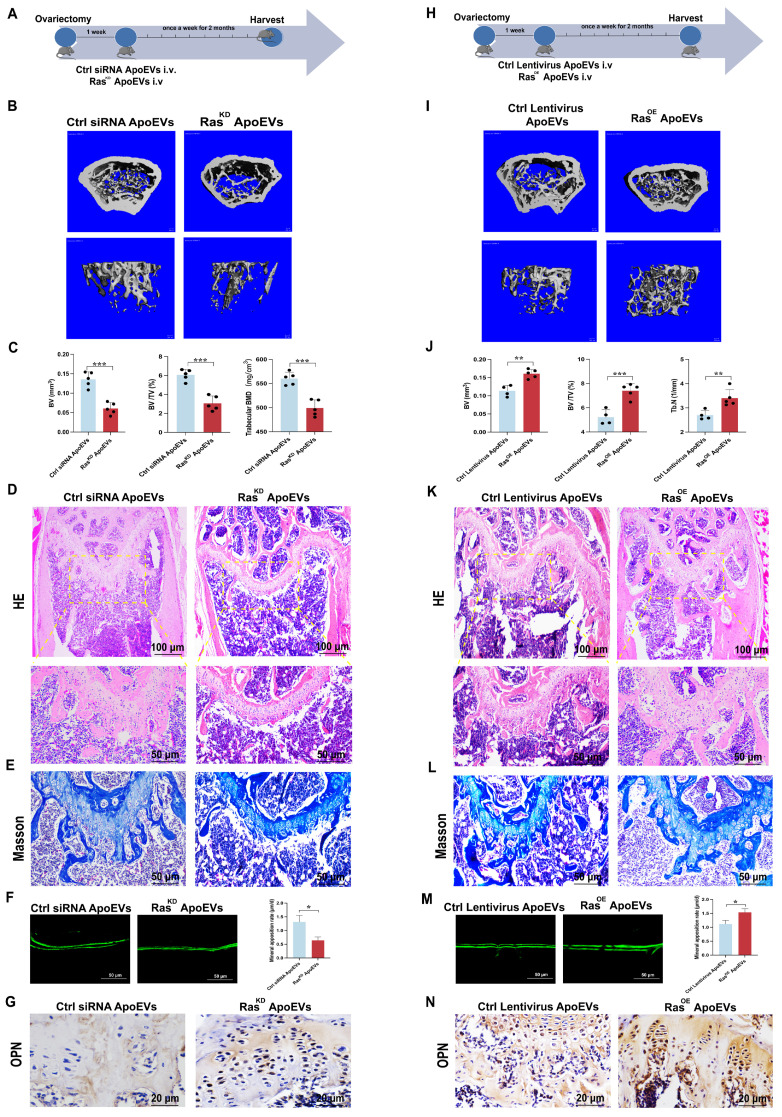
Figure 5.
ApoEVs ameliorate osteoporosis via Ras signal. (A) Schematic view of the experimental procedure. Control siRNA ApoEVs and RasKD ApoEVs were injected into OVX mice weekly for two months. (B-C) Three-dimensional reconstruction images of μCT illustrating bone microarchitecture in the distal femur, and quantitative analysis of BV, BV/TV, and BMD. n=5 biologically independent animals per group. (D) HE and (E) Masson depicting fewer osteoblast-like cells at the growth plate metaphysis in RasKD ApoEVs treated mice. Scale bar: 100 μm and 50 μm (D); 50μm (E). (F) Calcein double labeling indicating a slower bone formation rate per bone surface in RasKD ApoEVs group. (G) IHC staining visualizing lower expression of OPN in RasKD ApoEVs group. Scale bar: 20 μm. (H) Schematic view of the experimental procedure. Control lentivirus ApoEVs and RasOE ApoEVs were injected into OVX mice weekly for two months. (I-J) Three-dimensional reconstruction images of μCT depicting bone microarchitecture in the distal femur, and quantitative analysis of BV, BV/TV, and Tb.N. n=4 biologically independent animals per group. (K) HE and (L) Masson staining revealing more osteoblast-like cells at the growth plate metaphysis in RasOE ApoEVs treated mice. Scale bar: 100 μm and 50 μm (K); 50μm (L). (M) Calcein double labeling demonstrating a faster bone formation rate per bone surface in the RasOE ApoEVs group. (N) IHC staining showing lower expression of OPN in RasOE ApoEVs group. Scale bar: 20 μm. Data are means ± SEMs. Statistical significance was determined by two-tailed paired t-test in (C, F, J, M). Not significant (ns) = P > 0.05, *P < 0.05, **P < 0.01, ***P < 0.001, ****P < 0.0001.

