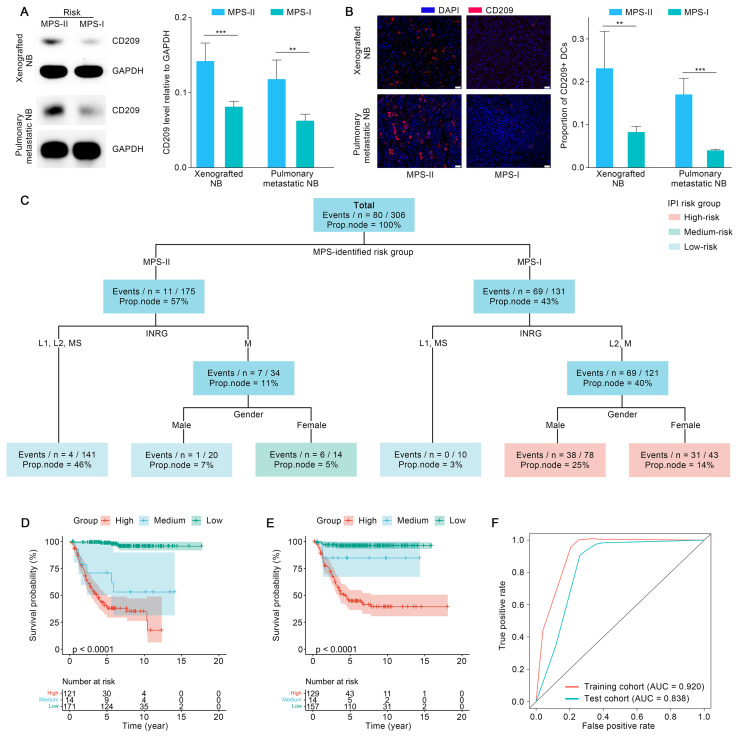
Figure 11.
The biological validation of immunosuppressive microenvironment of MPS-1 samples and the construction and validation of IPI. (A), Western blotting quantified the CD209 levels in the MPS-I and MPS-II xenografted and pulmonary metastatic NB mouse models. (B), CD209 staining revealed the infiltration profile of DCs in the xenografted and pulmonary metastatic NB subtypes. (C), The parameters of IPI. (D) and (E) exhibited the stratification ability of IPI in the training and test cohort. (F), TROC curves confirmed the prediction accuracy of IPI. All the scale bars are 50μm. Abbreviations: Proportion of patients in the node (Prop. Node).

