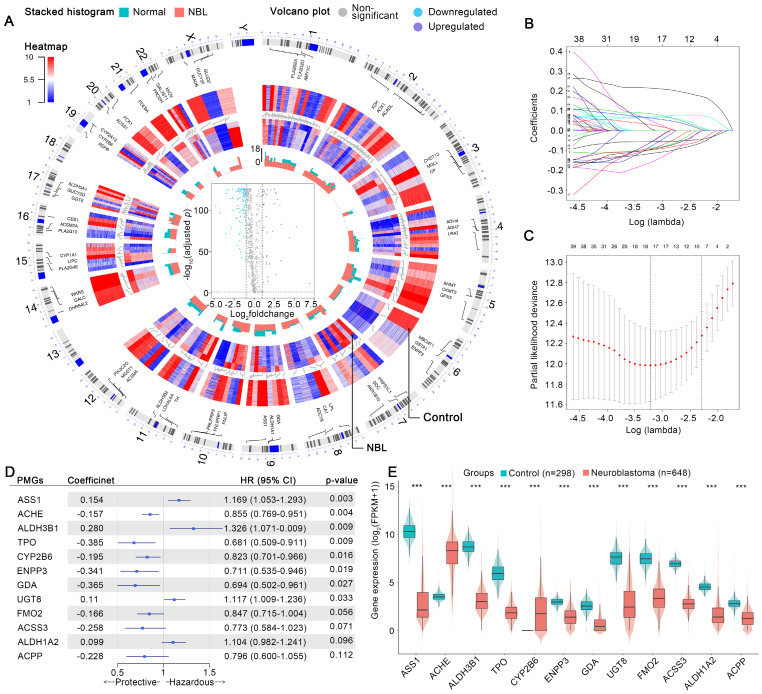
Figure 2.
Features selection and MPS modeling. (A) Visualized variations in omics data and machine-learning analyzed results by generated circos plot, which showed the illuminating process of the aberrant expression profiles of metabolic genes in NB. From outermost track to innermost track, the following were exhibited in order: Track 1, homo sapiens chromosome coordinates and scales, and the result analyzed using the corresponding method in each gene were plotted, on all subsequent tracks, according to its chromosomal location. Track 2, the top 3 MGs ordered by log2foldchange in each chromosome were shown. Track 3, expression profiles of MGs in all normal samples of the control cohort. Track 4, expression profiles of MGs in all samples of the NB cohort. Track 5, stacked histogram exhibited the MGs mean expression in control or NB cohort; green represents the control cohort and red represents the NB cohort. Track 6, volcano plot of MGs expression changes in the NB cohort. (B) Expression of 12 selected MGs in neuroblastoma and normal tissue. (C) Each line represents the coefficient of a specific MG screened to have significant prognostic potential. (D) A plot of partial likelihood deviance. (E) A forest plot of MPS coefficients and its subcomponent MGs hazard ratios.

