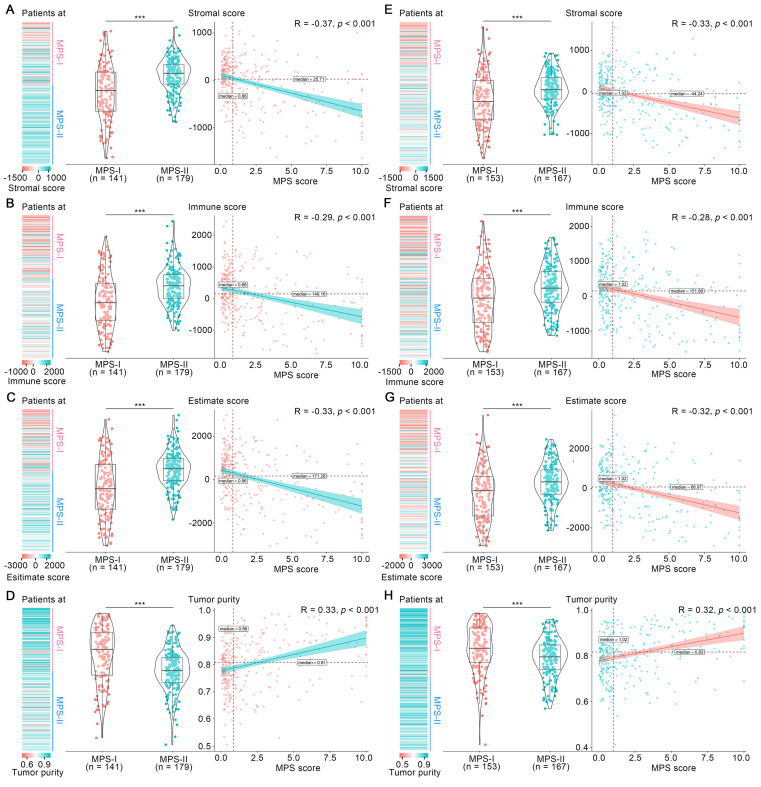
Figure 5.
Overall tumor-microenvironment of MPS-I and MPS-II NB. In the training cohort, (A), (B), (C) and (D) represent the distribution, grouped comparison and correlation of Stromal score, Immune score, ESTIMATE score and Tumor purity, respectively. In the test cohort, (E), (F), (G) and (H) represents the distribution, grouped comparison and correlation of Stromal score, Immune score, ESTIMATE score and Tumor purity, respectively.

