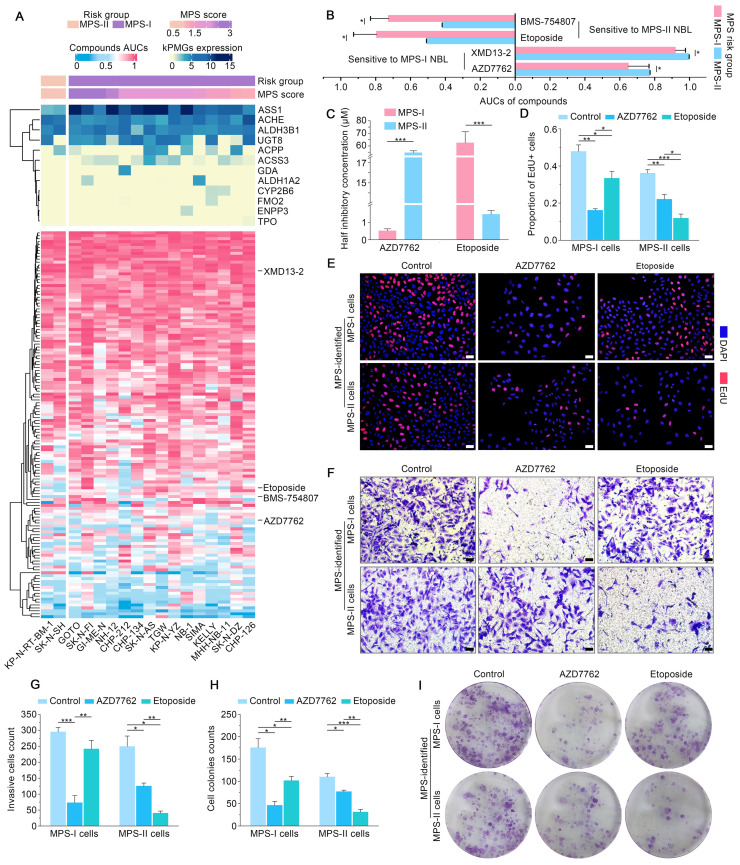
Figure 8.
Individualized treatment prediction and biological validation of MPS-based individualized treatment in the established human NB cells models. (A) Heatmap exhibited kPMGs expression (these were used for MPS risk-stratification), MPS score and MPS group of each included neuroblastoma CCLs; also shown are the identified therapeutic agents and their AUCs. (B) Difference of each identified drug's AUC between MPS-subtyped neuroblastoma. (C) IC50 differences of AZD7762 and etoposide between MPS-identified NB subgroups. (D) and (E), Results of EdU assays, the scale bar is 50μm. (F) and (H), transwell assays measured the invasion capacity of NB cells after treatment. (G) and (I), measurement of cell colonies formation capacity of NB cells after treatment.

