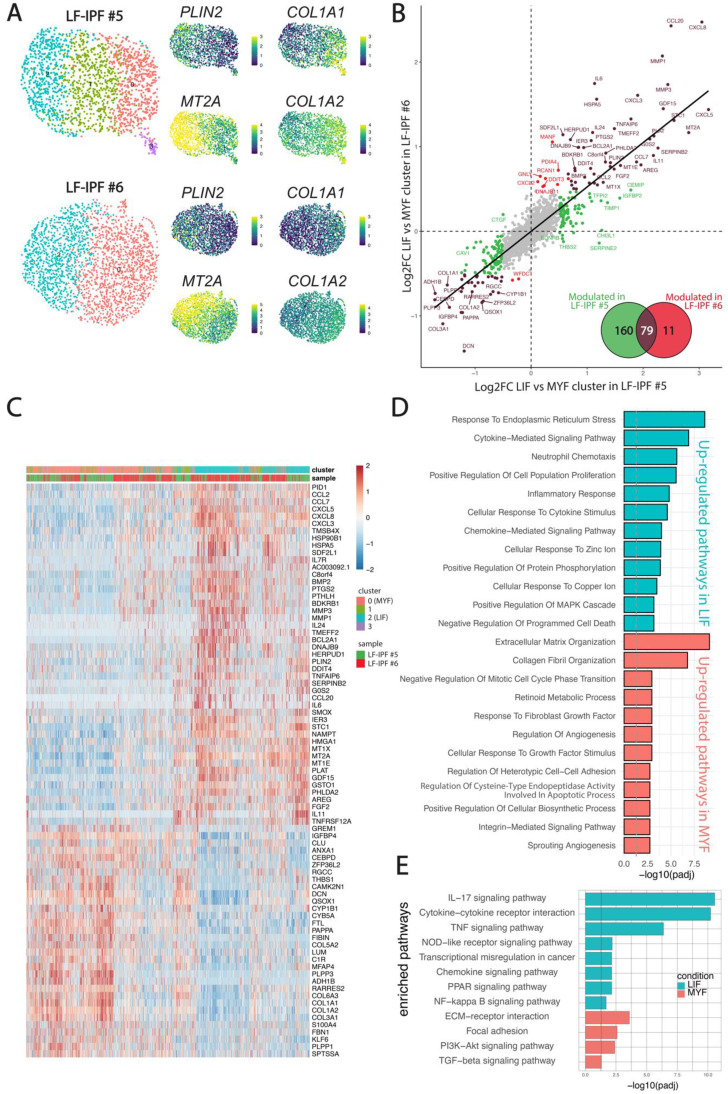
Figure 3.
Evidence for presence of LIF and MYF clusters in non-treated LF-IPF samples. (A) UMAP for the two independent vehicle-treated LF-IPF. Corresponding heatmap and expression of COL1A1/COL1A2 and PLIN2/MT2A suggest the simultaneous presence of MYF and LIF in LF-IPF samples. (B) Correlation of the LIF vs MYF genes in the 2 LF-IPF. The log2 Fold change (MYF vs LIF) for each gene is plotted. Brown dots correspond to genes significantly modulated in both LF-IPF#5 and LF-IPF#6. Green and red dots correspond to genes significantly modulated in either LF-IPF#5 and LF-IPF#6, respectively. The Venn diagram shows the differentially expressed genes between the MYF and the LIF clusters in the 2 LF-IPF. (C) Heatmap integrating the 2 samples showing the main gene markers for each subclusters. Note the strong similarity between the LIF and MYF clusters for the 2 independent LF-IPF. (D-E) Functions (GOBP) and pathway (KEGG) enrichment analyses on differentially regulated genes between the LIF and the MYF clusters.

