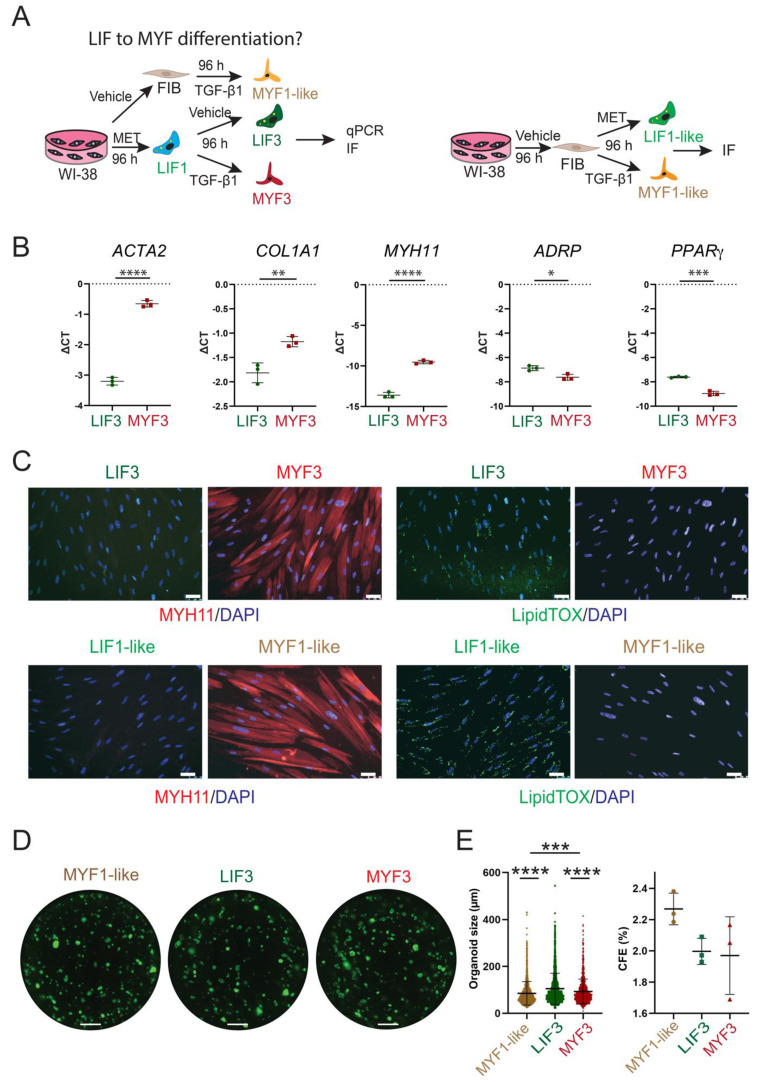
Figure 8.
Evidence for LIF to MYF differentiation. (A) Experimental approach. (B) qPCR expression of MYF and LIF markers, n = 3. (C) IF for MYH11 and LipidTox™, n = 3. (D) An alveolosphere assay shows the organoids corresponding to co-culture of MYF1-like, LIF3, and MYF3 with SftpcGFP+ cells at day 14. (E) Quantification of organoid size and colony formation efficiency, n = 3. P values * P < 0.05; ** P < 0.01; *** P < 0.001; **** P < 0.0001. Scale bar C: 50 μm and D: 1250 μm.

