. 2024 Jun 20;32(7):1197–1207. doi: 10.32604/or.2024.046139

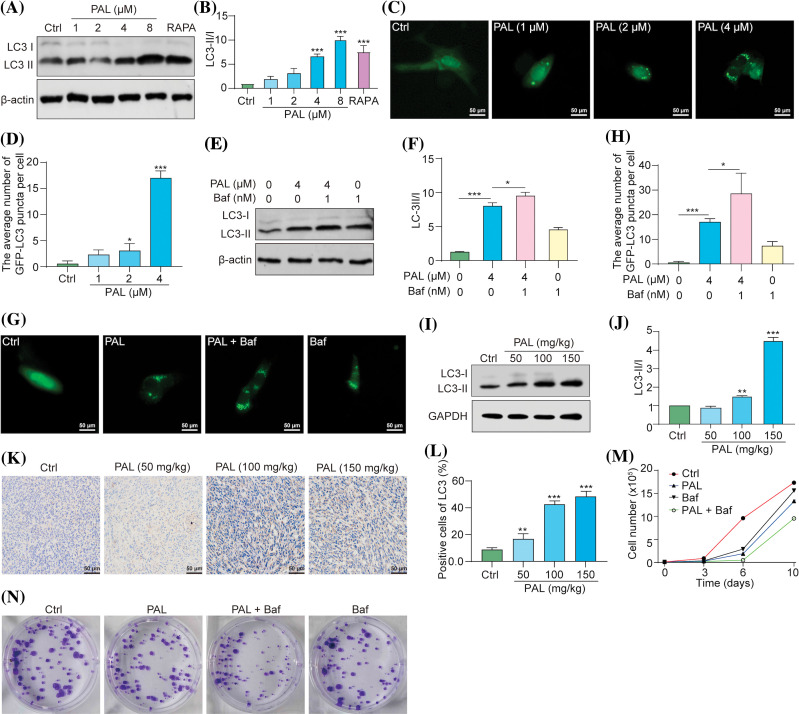
Figure 2. PAL triggers protective autophagy in breast cancer. (A) Western blotting analysis of LC3 from the protein lysate of MCF7 cells treated with RAPA and PAL at indicated concentrations. (B) A bar chart showing the ratio of LC3-II to LC3-I. (C) Representative images of pEGFP-LC3 transfected MCF7 cells treated with PAL at indicated concentrations. Magnification: 40×. Scale bar: 50 μm. (D) A bar chart showing the average number of GFP-LC3 puncta per cell. (E) Western blotting analysis of LC3 from the protein lysate of PAL-treated MCF7 cells, with or without Baf. (F) A bar chart indicating the ratio of LC3-II to LC3-I. (G) Representative images of EGFP-LC3 transfected MCF7 cells treated with PAL in the presence or absence of Baf. Magnification: 40×. Scale bar: 50 μm. (H) A bar chart showing the average number of GFP-LC3 puncta per cell. (I) Western blotting analysis of LC3 from the protein lysate of tumor tissue extracted from nude mice treated with either vehicle or PAL. (J) A bar chart indicating the ratio of LC3-II to LC3-I. (K) Representative immunohistochemical analysis images of LC3 from sections of tumor tissue. Magnification: 40×. Scale bar: 50 μm. (L) A bar chart showing the percentage of positive cells for LC3 expression. (M) A curve line graph indicating the number of PAL-treated MCF7 cells in the presence or absence of Baf. (N) Representative crystal violet staining images depicting the colony formation of PAL-treated MCF7 cells in the presence or absence of Baf. Bar. S.D., *p < 0.05, **p < 0.01, ***p < 0.001. Full unedited gel/blots are provided in Suppl. Fig. S2, where the protein molecular weight markers were labeled.

Figure 2