. 2024 Jun 20;32(7):1197–1207. doi: 10.32604/or.2024.046139

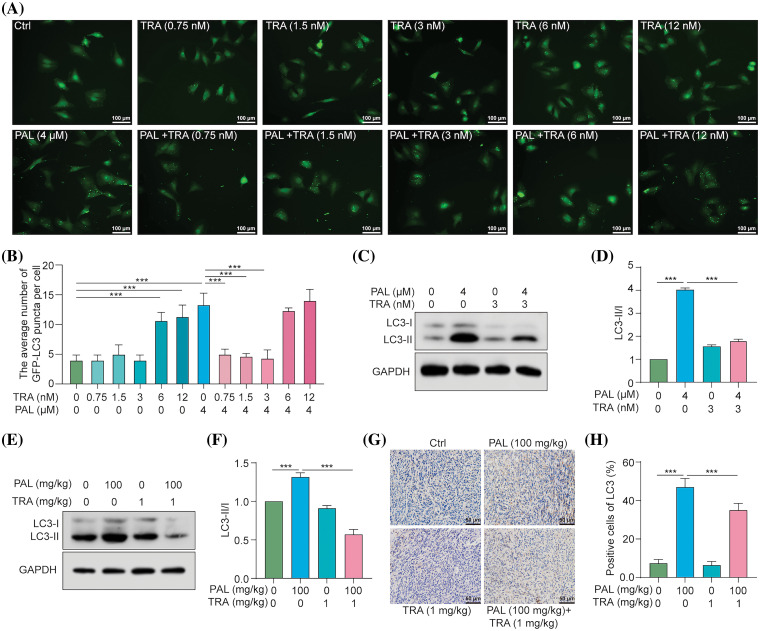
Figure 4. TRA inhibits PAL-induced autophagy in breast cancer. (A) Representative images depicting GFP-LC3 puncta in U87 cells treated with PAL in the presence or absence of TRA at indicated concentrations. Magnification: 20×. Scale bar: 100 μm. (B) A bar chart showing the average number of GFP-LC3 puncta per cell. (C) Western blotting analysis of LC3 from the protein lysate of PAL-treated MCF7 cells with or without TRA. (D) A bar chart indicating the ratio of LC3-II to LC3-I. (E) Western blotting analysis of LC3 from the protein lysate of tumor tissue extracted from nude mice treated with PAL, with or without TRA. (F) A bar chart showing the ratio of LC3-II to LC3-I in the tumor tissue. (G) Representative immunohistochemical analysis images of LC3 in tumor tissue from PAL-treated nude mice, with or without TRA. Magnification: 40×. Scale bar: 50 μm. (H) A bar chart indicating the percentage of cells positive for LC3 in the tumor tissue. Bar. S.D., ***p < 0.001. Full unedited gel/blots are provided in Suppl. Fig. S4, where the protein molecular weight markers were labeled.

Figure 4