. 2024 Jun 20;32(7):1197–1207. doi: 10.32604/or.2024.046139

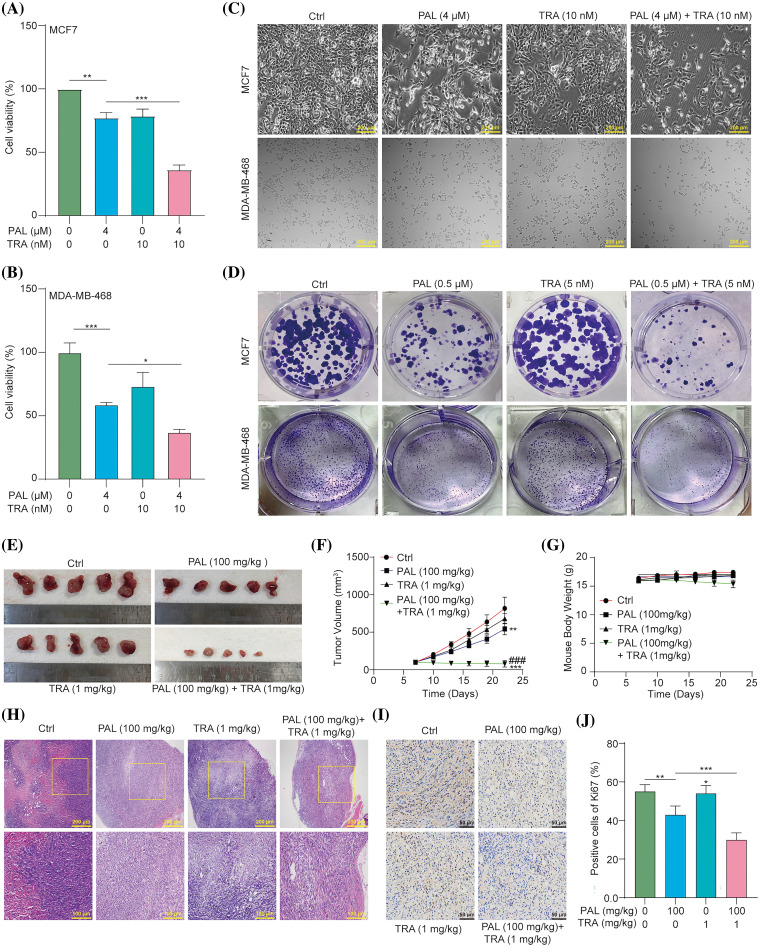
Figure 5. TRA augments PAL sensitivity in breast cancer. (A, B) Bar charts showing the cell viability of PAL-treated MCF7 and MDA-MB-468 cells with or without TRA at indicated concentrations for 24 h. (C) Representative images of cellular morphology images for PAL-treated MCF7 cells and MDA-MB-468 cells with or without TRA at indicated concentrations for 24 h. Magnification: 10×. Scale bar: 200 μm. (D) Representative crystal violet staining images displaying the colony formation of PAL-treated MCF7 cells and MDA-MB-468 cells with or without TRA at indicated concentrations. (E) Images showing the appearance of the MCF7 tumors extracted from nude mice treated with PAL, with or without TRA. (F) A curve line graph indicating the tumor volume of PAL-treated nude mice with or without TRA. (G) A curve line graph showing the body weight of PAL-treated nude mice with or without TRA. (H) Representative H&E staining images of tumor tissue from PAL-treated nude mice with or without TRA. Magnification: 10× (upper panel) and 20× (lower panel). Scale bar: 200 μm (upper panel) and 100 μm (lower panel). (I) Representative immunohistochemical analysis images of Ki67 in tumor tissue from PAL-treated nude mice with or without TRA. Magnification: 40×. Scale bar: 50 μm. (J) A bar chart indicating the percentage of cells positive for Ki67. Bar. S.D., *p < 0.05, **p < 0.01, ***p < 0.001, ###p < 0.001 vs. PAL (100 mg/kg).

Figure 5