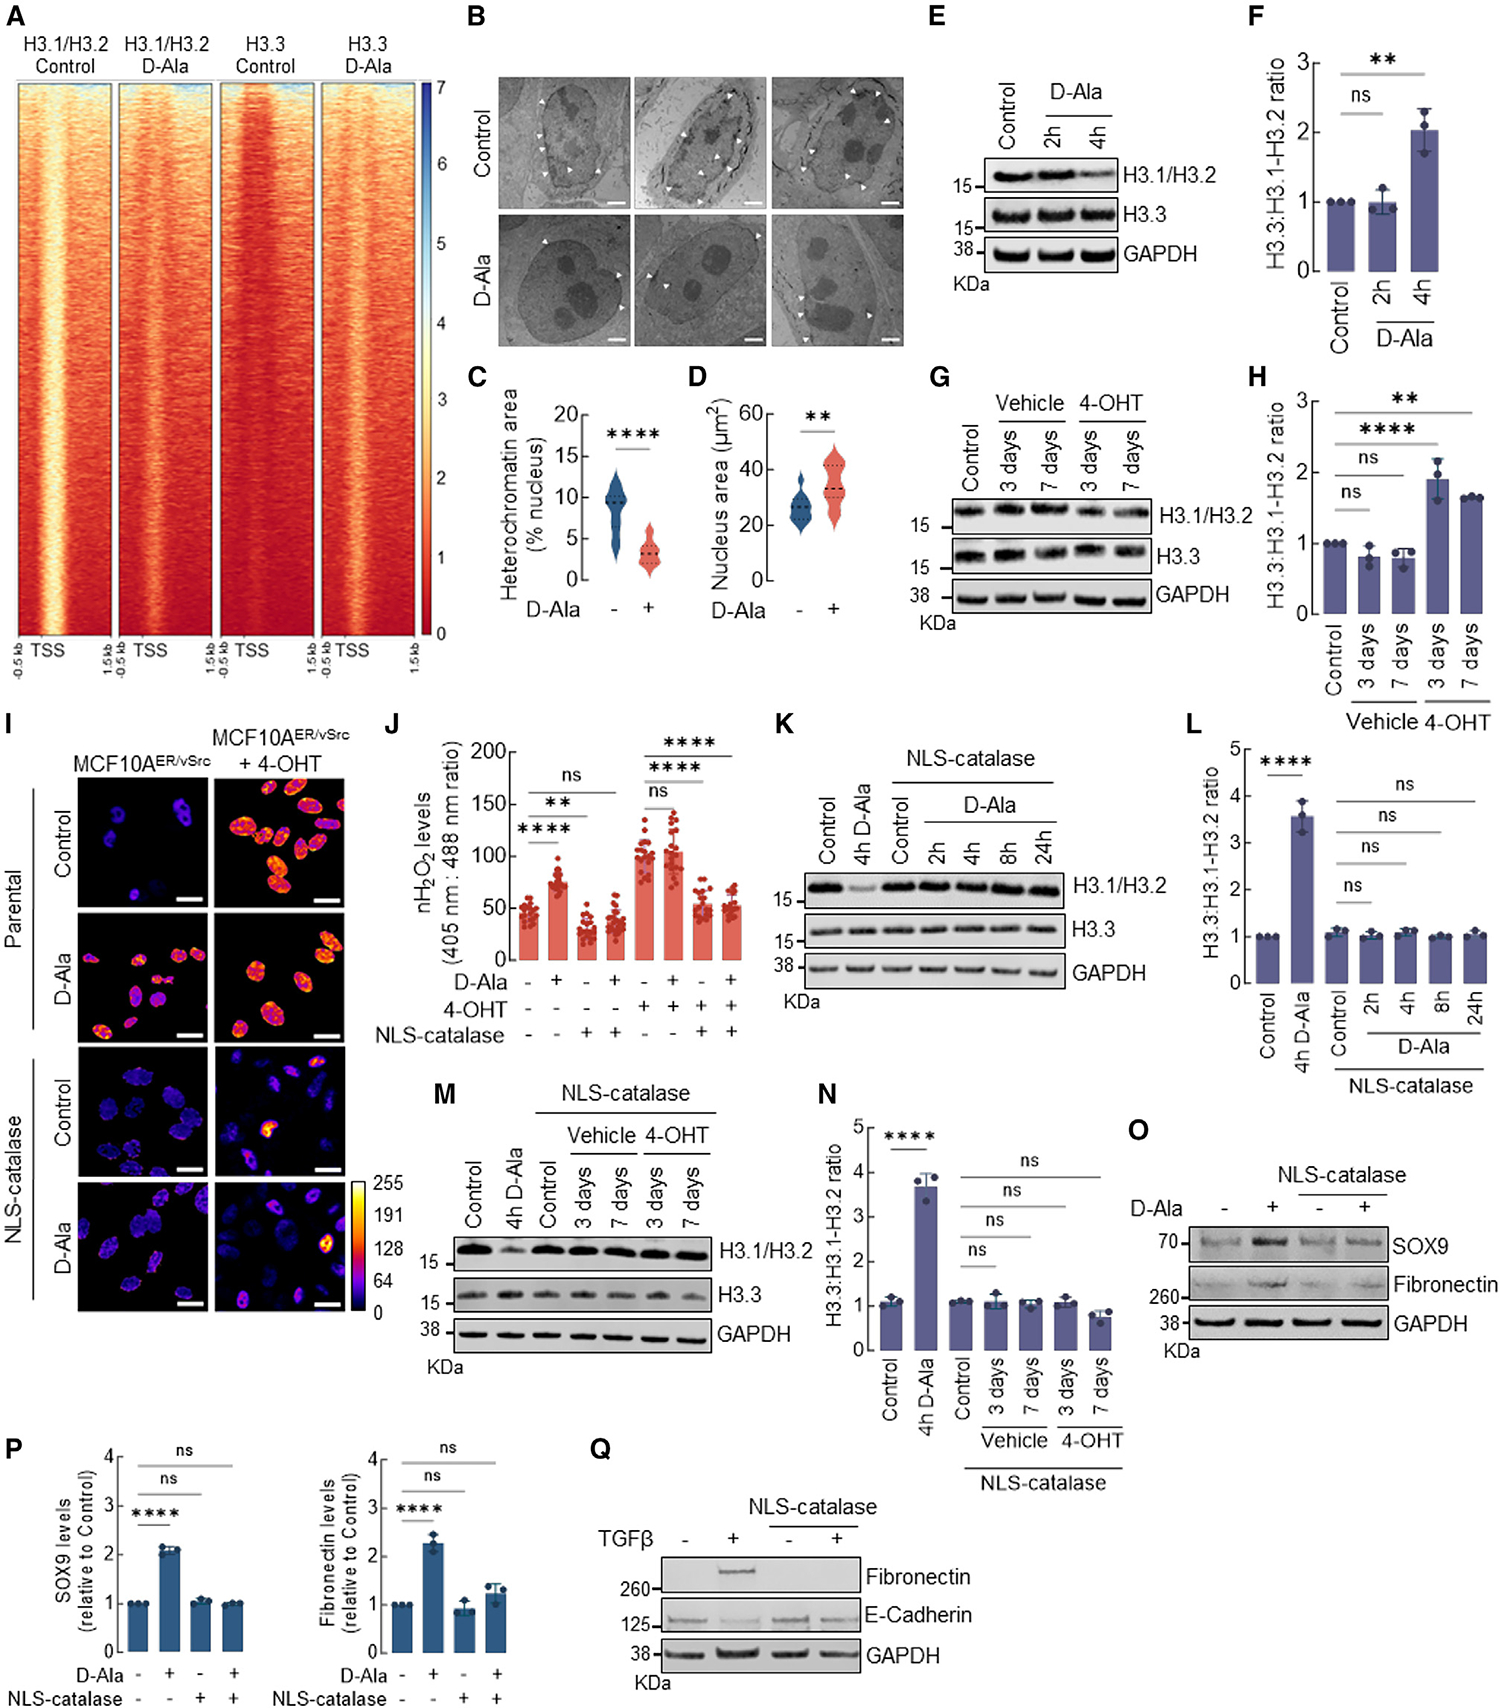
Figure 2. nH2O2 promotes H3.1/H3.2 and H3.3 remodeling associated with EMT activation.

(A) Heatmap of H3.1/H3.2 and H3.3 ChIP-seq peaks across TSS (−0.5 kb, +1.5 kb) in MCF10AER/vSrc cells 4 h after 10 nM d-Ala treatment. On the side scale, 0 represents low occupancy, whereas higher numbers represent increased occupancy levels.
(B) Representative images of heterochromatin distribution in cells 4 h after 10 nM d-Ala treatment. Heterochromatin was assessed by TEM. White arrows indicate heterochromatin. Scale bars, 2 μm.
(C) Quantification of perinuclear heterochromatin in (B) using Trainable Weka Segmentation plug-in in Fiji ImageJ. Statistical significance was determined by t test. ****p < 0.0001.
(D) Area of the nucleus of cells in (B). Statistical significance was determined by t test. **p < 0.01.
(E) Western blot analysis of H3.1-H3.2 and H3.3 in MCF10AER/vSrc cells 2 or 4 h after 10 nM d-Ala treatment.
(F) H3.3:H3.1-H3.2 ratio quantification of (E). Statistical significance was determined by 1-way ANOVA with post hoc Tukey test. Bars represent mean ± SEM. **p < 0.01; ns, not significant.
(G) Western blot analysis of H3.1-H3.2 and H3.3 in MCF10AER/vSrc transformed cells (3 and 7 days after treatment with 4-OHT).
(H) H3.3:H3.1-H3.2 ratio quantification of (G). Statistical significance was determined by 1-way ANOVA with post hoc Tukey test. Bars represent mean ± SEM. **p < 0.01; ****p < 0.0001; ns, not significant.
(I) The levels of H2O2 in the nucleus of MCF10AER/vSrc cells expressing NLS-catalase and treated with 10 nM d-Ala or transformed with 4-OHT were determined using confocal microscopy. Oxidized (λex = 405 nm) and reduced (λex = 488 nm) roGFP2 signals were acquired, and the oxidized:reduced ratio was calculated using ImageJ (shown as a heatmap). White bars represent 20 μm. On the heatmap scale, 0 represents low ROS levels, whereas warmer colors toward the 255 mark represent relatively higher ROS levels.
(J) Quantification of oxidized:reduced ratio of nuclear Orp1-roGFP2 in (I). Statistical significance was determined by 1-way ANOVA with post hoc Tukey test. Bars represent mean ± SEM. **p < 0.01; ****p < 0.0001; ns, not significant.
(K) Western blot analysis of H3.1-H3.2 and H3.3 in MCF10AER/vSrc cells expressing NLS-catalase. Indicated times represent points when cells were harvested relative to t = 0 h (10 nM d-Ala addition to the media).
(L) H3.3:H3.1-H3.2 ratio quantification in (K). Statistical significance was determined by 1-way ANOVA with post hoc Tukey test. Bars represent mean ± SEM. ****p < 0.0001; ns, not significant.
(M) Western blot analysis of H3.1-H3.2 and H3.3 in MCF10AER/vSrc transformed cells (3 and 7 days after treatment with 4-OHT) expressing NLS-catalase.
(N) H3.3:H3.1-H3.2 ratio quantification in (M). Statistical significance was determined by 1-way ANOVA with post hoc Tukey test. Bars represent mean ± SEM. ****p < 0.0001; ns, not significant.
(O) Western blot analysis of SOX9 and fibronectin (EMT markers) in MCF10AER/vSrc cells expressing NLS-catalase 8 h after 10 nM d-Ala treatment.
(P) Quantification of SOX9 and fibronectin protein levels in (O). Statistical significance was determined by 1-way ANOVA with post hoc Tukey test. Bars represent mean ± SEM. ****p < 0.0001; ns, not significant.
(Q) EMT induction in MCF10A cells treated with TGF-β. Parental and NLS-catalase-expressing cells were treated with 10 ng/mL TGF-β for 14 days. The levels of the mesenchymal marker fibronectin and the epithelial marker E-cadherin were determined by western blot.
