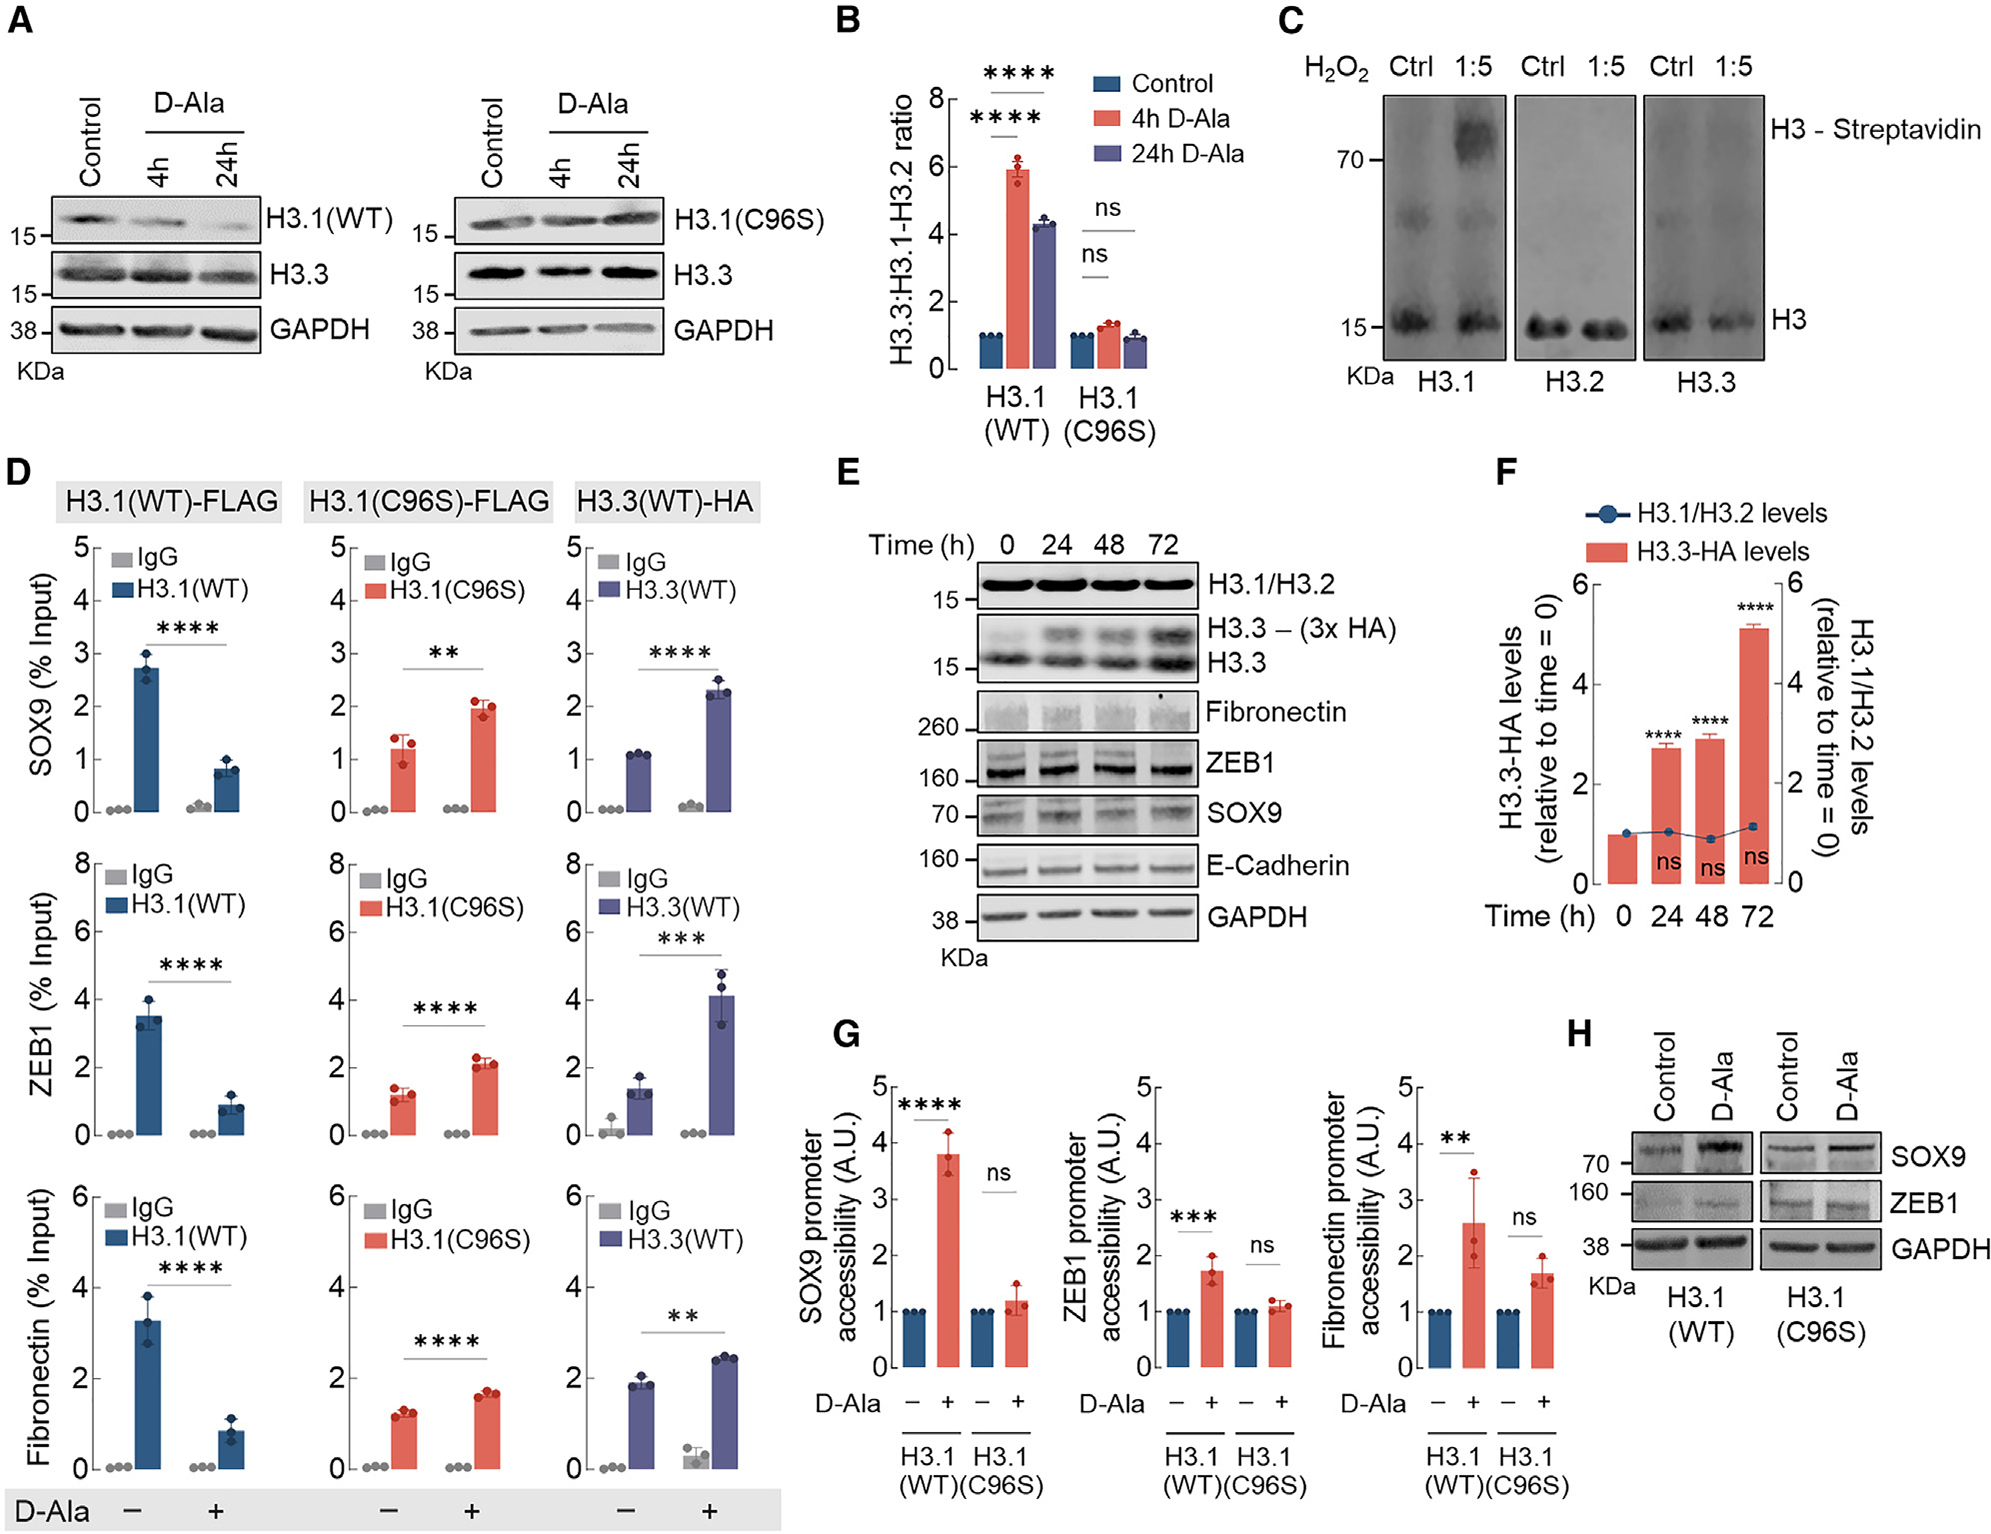
Figure 3. H3.1 histone is distinctively sensitive and is evicted from chromatin by nH2O2.

(A) Western blot analysis of H3.1 (WT and C96S) and H3.3 (endogenous) in MCF10AER/vSrc cells 4 and 24 h after 10 nM d-Ala treatment.
(B) H3.3/H3.1-H3.2 ratio quantification of (A). Statistical significance was determined by 2-way ANOVA with post hoc Bonferroni test. Bars represent mean ± SEM. ****p < 0.0001; ns, not significant.
(C) H3 variants labeling with DCP-Bio1. Recombinant H3.1, H3.2, and H3.3 were treated with H2O2 and incubated with biotin-conjugated DCP-Bio1, a dimedone derivative that labels oxidized Cys-SOH sulfenic acid residues. Biotin-conjugated DCP-Bio1 adducts were determined by western blot after incubation with Alexa Fluor-labeled streptavidin.
(D) H3.1(WT)-FLAG, H3.1(C96S)-FLAG, and H3.3-HA enrichment (ChIP-qPCR) in promoter regions of SOX9, ZEB1, and fibronectin in MCF10AER/vSrc cells 8 h after 10 nM d-Ala treatment. Statistical significance was determined by 2-way ANOVA with post hoc Bonferroni test. Bars represent mean ± SEM. **p < 0.01; ***p < 0.001; ****p < 0.0001.
(E) H3.3 expression does not affect the expression of H3.1-H3.2 or EMT genes. Overexpressing inducible H3.3-HA did not interfere with levels of endogenous H3.1-H3.2 or mesenchymal markers (fibronectin, ZEB1, and SOX9) and epithelial marker (E-cadherin).
(F) H3.1-H3.2 levels in response to H3.3-HA overexpression in (E). Statistical significance was determined by 1-way ANOVA with post hoc Tukey test. Bars represent mean ± SEM. ****p < 0.0001; ns, not significant.
(G) SOX9, ZEB1, and fibronectin gene accessibility in MCF10AER/vSrc cells expressing H3.1(WT) or H3.1(C96S) 4 h after 10 nM d-Ala treatment. Chromatin accessibility was determined in the promoter region of SOX9, ZEB1, and fibronectin. Statistical significance was determined by 1-way ANOVA with post hoc Tukey test. Bars represent mean ± SEM. **p < 0.01; ***p < 0.001; ****p < 0.0001; ns, not significant.
(H) Western blot analysis of SOX9 and ZEB1 in MCF10AER/vSrc cells expressing H3.1(WT) or H3.1(C96S) 24 h after 10 nM d-Ala treatment.
See also Figures S3 and S4.
