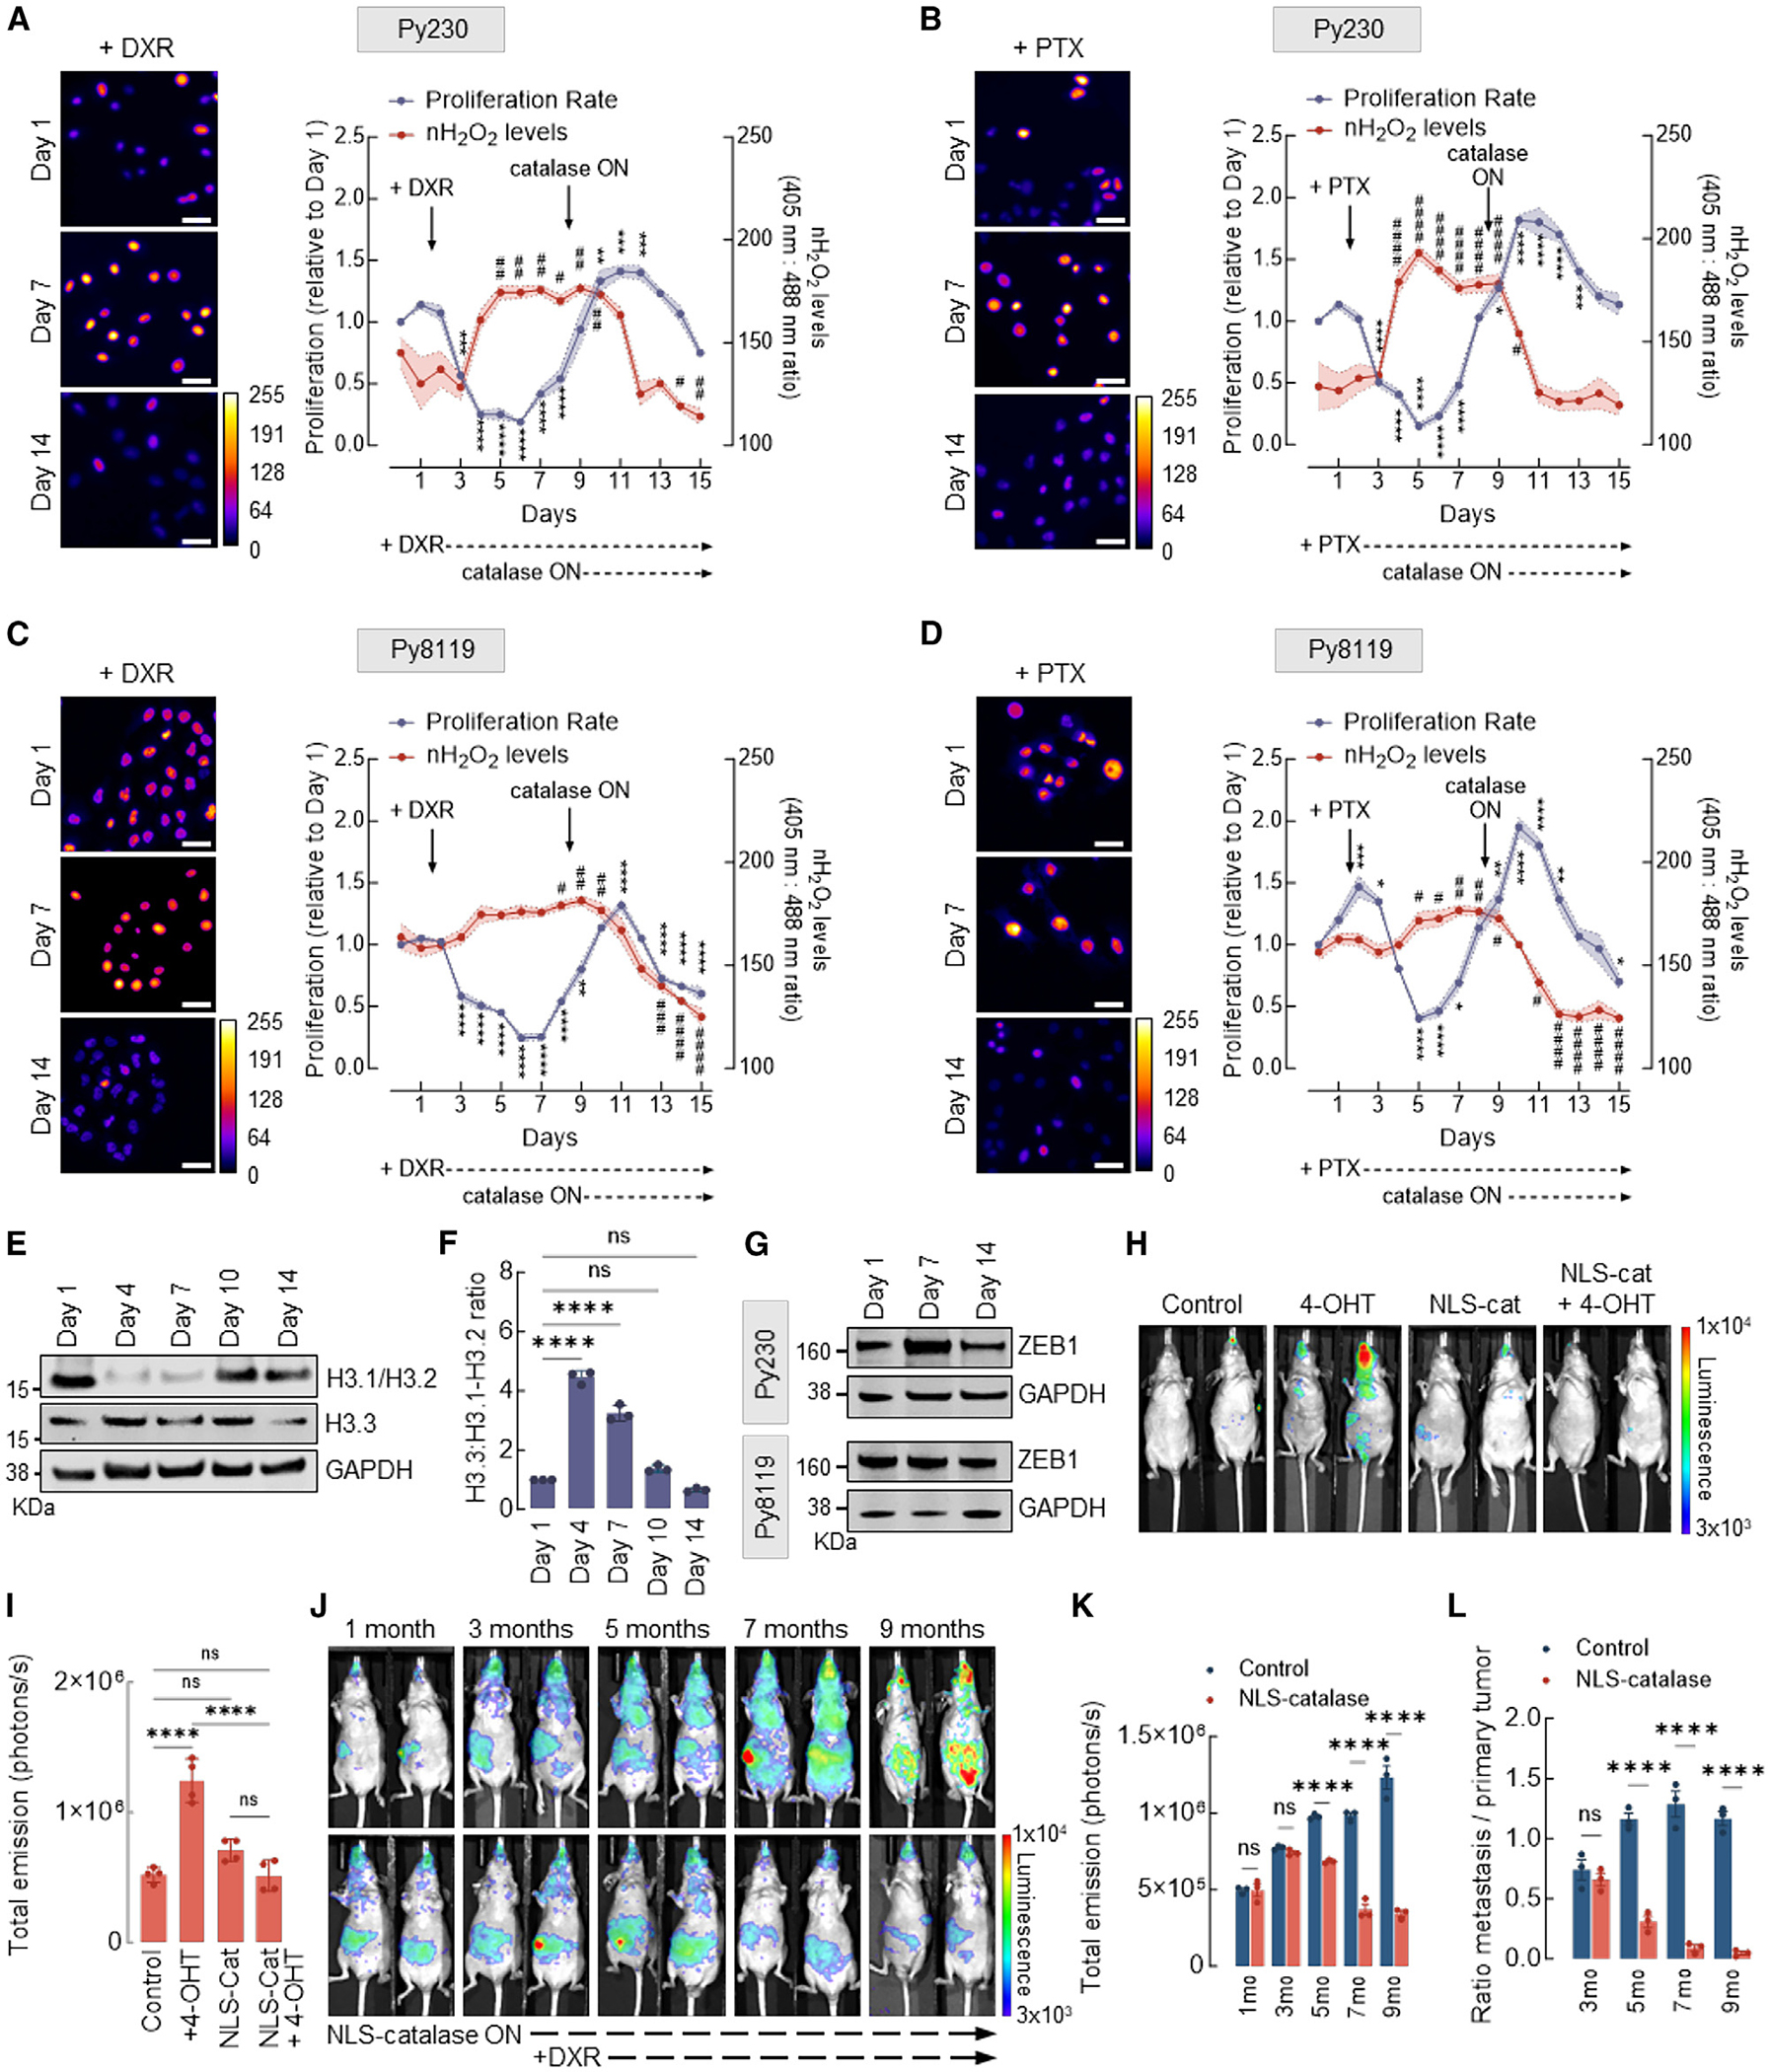
Figure 5. nH2O2 promotes chemoresistance, tumorigenicity, and metastasis of mammary xenograft tumors.

(A) Cell proliferation and levels of H2O2 in the nucleus of murine mammary carcinoma Py230 cells expressing inducible NLS-catalase and treated with 200 nM DXR. Oxidized (λex = 405 nm) and reduced (λex = 488 nm) roGFP2 signals were acquired, and the ratio oxidized:reduced was calculated using ImageJ (shown as a heatmap). Cell proliferation is relative to day 1. White bars represent 50 μm. Statistical significance was determined by 1-way ANOVA with post hoc Tukey test (proliferation and nH2O2 calculated separately). Lines and shadows represent mean ± SEM. **p < 0.01, ***p < 0.001, and ****p < 0.0001 (for proliferation) and #p < 0.05 and ##p < 0.01 (for nH2O2 levels). On the heatmap scale, 0 represents low ROS levels, whereas warmer colors toward the 255 mark represent relatively higher ROS levels.
(B) Cell proliferation and levels of H2O2 in the nucleus of Py230 cells expressing inducible NLS-catalase and treated with 10 nM PTX. Oxidized (λex = 405 nm) and reduced (λex = 488 nm) roGFP2 signals were acquired, and the ratio oxidized:reduced was calculated using ImageJ (shown as a heatmap). Cell proliferation is relative to day 1. White bars represent 50 μm. Statistical significance was determined by 1-way ANOVA with post hoc Tukey test (proliferation and nH2O2 calculated separately). Lines and shadows represent mean ± SEM. *p < 0.05, ***p < 0.001, and ****p < 0.0001 (for proliferation) and #p < 0.05 and ####p < 0.0001 (for nH2O2 levels). On the heatmap scale, 0 represents low ROS levels, whereas warmer colors toward the 255 mark represent relatively higher ROS levels.
(C) Cell proliferation and levels of H2O2 in the nucleus of Py8119 cells expressing inducible NLS-catalase and treated with 200 nM DXR. Oxidized (λex = 405 nm) and reduced (λex = 488 nm) roGFP2 signals were acquired, and the ratio oxidized:reduced was calculated using ImageJ (shown as a heatmap). Cell proliferation is relative to day 1. White bars represent 50 μm. Statistical significance was determined by 1-way ANOVA with post hoc Tukey test (proliferation and nH2O2 calculated separately). Lines and shadows represent mean ± SEM. **p < 0.01 and ****p < 0.0001 (for proliferation) and #p < 0.05, ##p < 0.01, ###p < 0.001, and ####p < 0.0001 (for nH2O2 levels). On the heatmap scale, 0 represents low ROS levels, whereas warmer colors toward the 255 mark represent relatively higher ROS levels.
(D) Cell proliferation and levels of H2O2 in the nucleus of Py8119 cells expressing inducible NLS-catalase and treated with 10 nM PTX. Oxidized (λex = 405 nm) and reduced (λex = 488 nm) roGFP2 signals were acquired, and the ratio oxidized:reduced was calculated using ImageJ (shown as a heatmap). Cell proliferation is relative to day 1. White bars represent 50 μm. Statistical significance was determined by 1-way ANOVA with post hoc Tukey test (proliferation and nH2O2 calculated separately). Lines and shadows represent mean ± SEM. *p < 0.05, **p < 0.01, and ****p < 0.0001 (for proliferation) and #p < 0.05, ##p < 0.01, and ####p < 0.0001 (for nH2O2 levels). On the heatmap scale, 0 represents low ROS levels, whereas warmer colors toward the 255 mark represent relatively higher ROS levels.
(E) Western blot analysis of H3.1/H3.2 and H3.3 in Py230 cells treated with 200 nM DXR at the indicated time points.
(F) H3.3:H3.1-H3.2 ratio quantification in (E). Statistical significance was determined by 1-way ANOVA with post hoc Tukey test. Bars represent mean ± SEM. ****p < 0.0001; ns, not significant.
(G) Western blot analysis of ZEB1 in Py230 cells (top) and Py8119 cells (bottom) treated with 200 nM DXR at the indicated different time points.
(H) Assessment of tumors in NU/J mice injected with 4-OHT-transformed MCF10AER/vSRC cells and expressing NLS-catalase. The injection of MCF10AER/vSrc cells (±4-OHT, ±NLS-catalase expression) was performed subcutaneously in the mammary fat pad, and the bioluminescent signal of tumors in representative animals is shown (13 weeks after injection). Luciferase signal was detected using high exposure for 120 s.
(I) Quantification of total emission in (H). Statistical significance was determined by 1-way ANOVA with post hoc Tukey test. Bars represent mean ± SEM. ****p < 0.0001; ns, not significant.
(J) Assessment of tumors in NU/J mice injected with 4-OHT-transformed MCF10AER/vSRC cells and expressing inducible NLS-catalase. The injection of 4-OHT-transformed MCF10AER/vSrc cells was performed subcutaneously in the mammary fat pad, and tumor growth and metastasis were measured monthly. The induction of NLS- catalase occurred after the third month, and the treatment with DXR was performed on a weekly basis after the fifth month. Luciferase signal was detected using high exposure for 120 s.
(K) Quantification of total emission in (J). Statistical significance was determined by 2-way ANOVA with post hoc Bonferroni test. Bars represent mean ± SEM. ****p < 0.0001; ns, not significant.
(L) Ratio metastasis:primary tumor of (J). Statistical significance was determined by 2-way ANOVA with post hoc Bonferroni test. Bars represent mean ± SEM. ****p < 0.0001; ns, not significant.
See also Figure S5.
