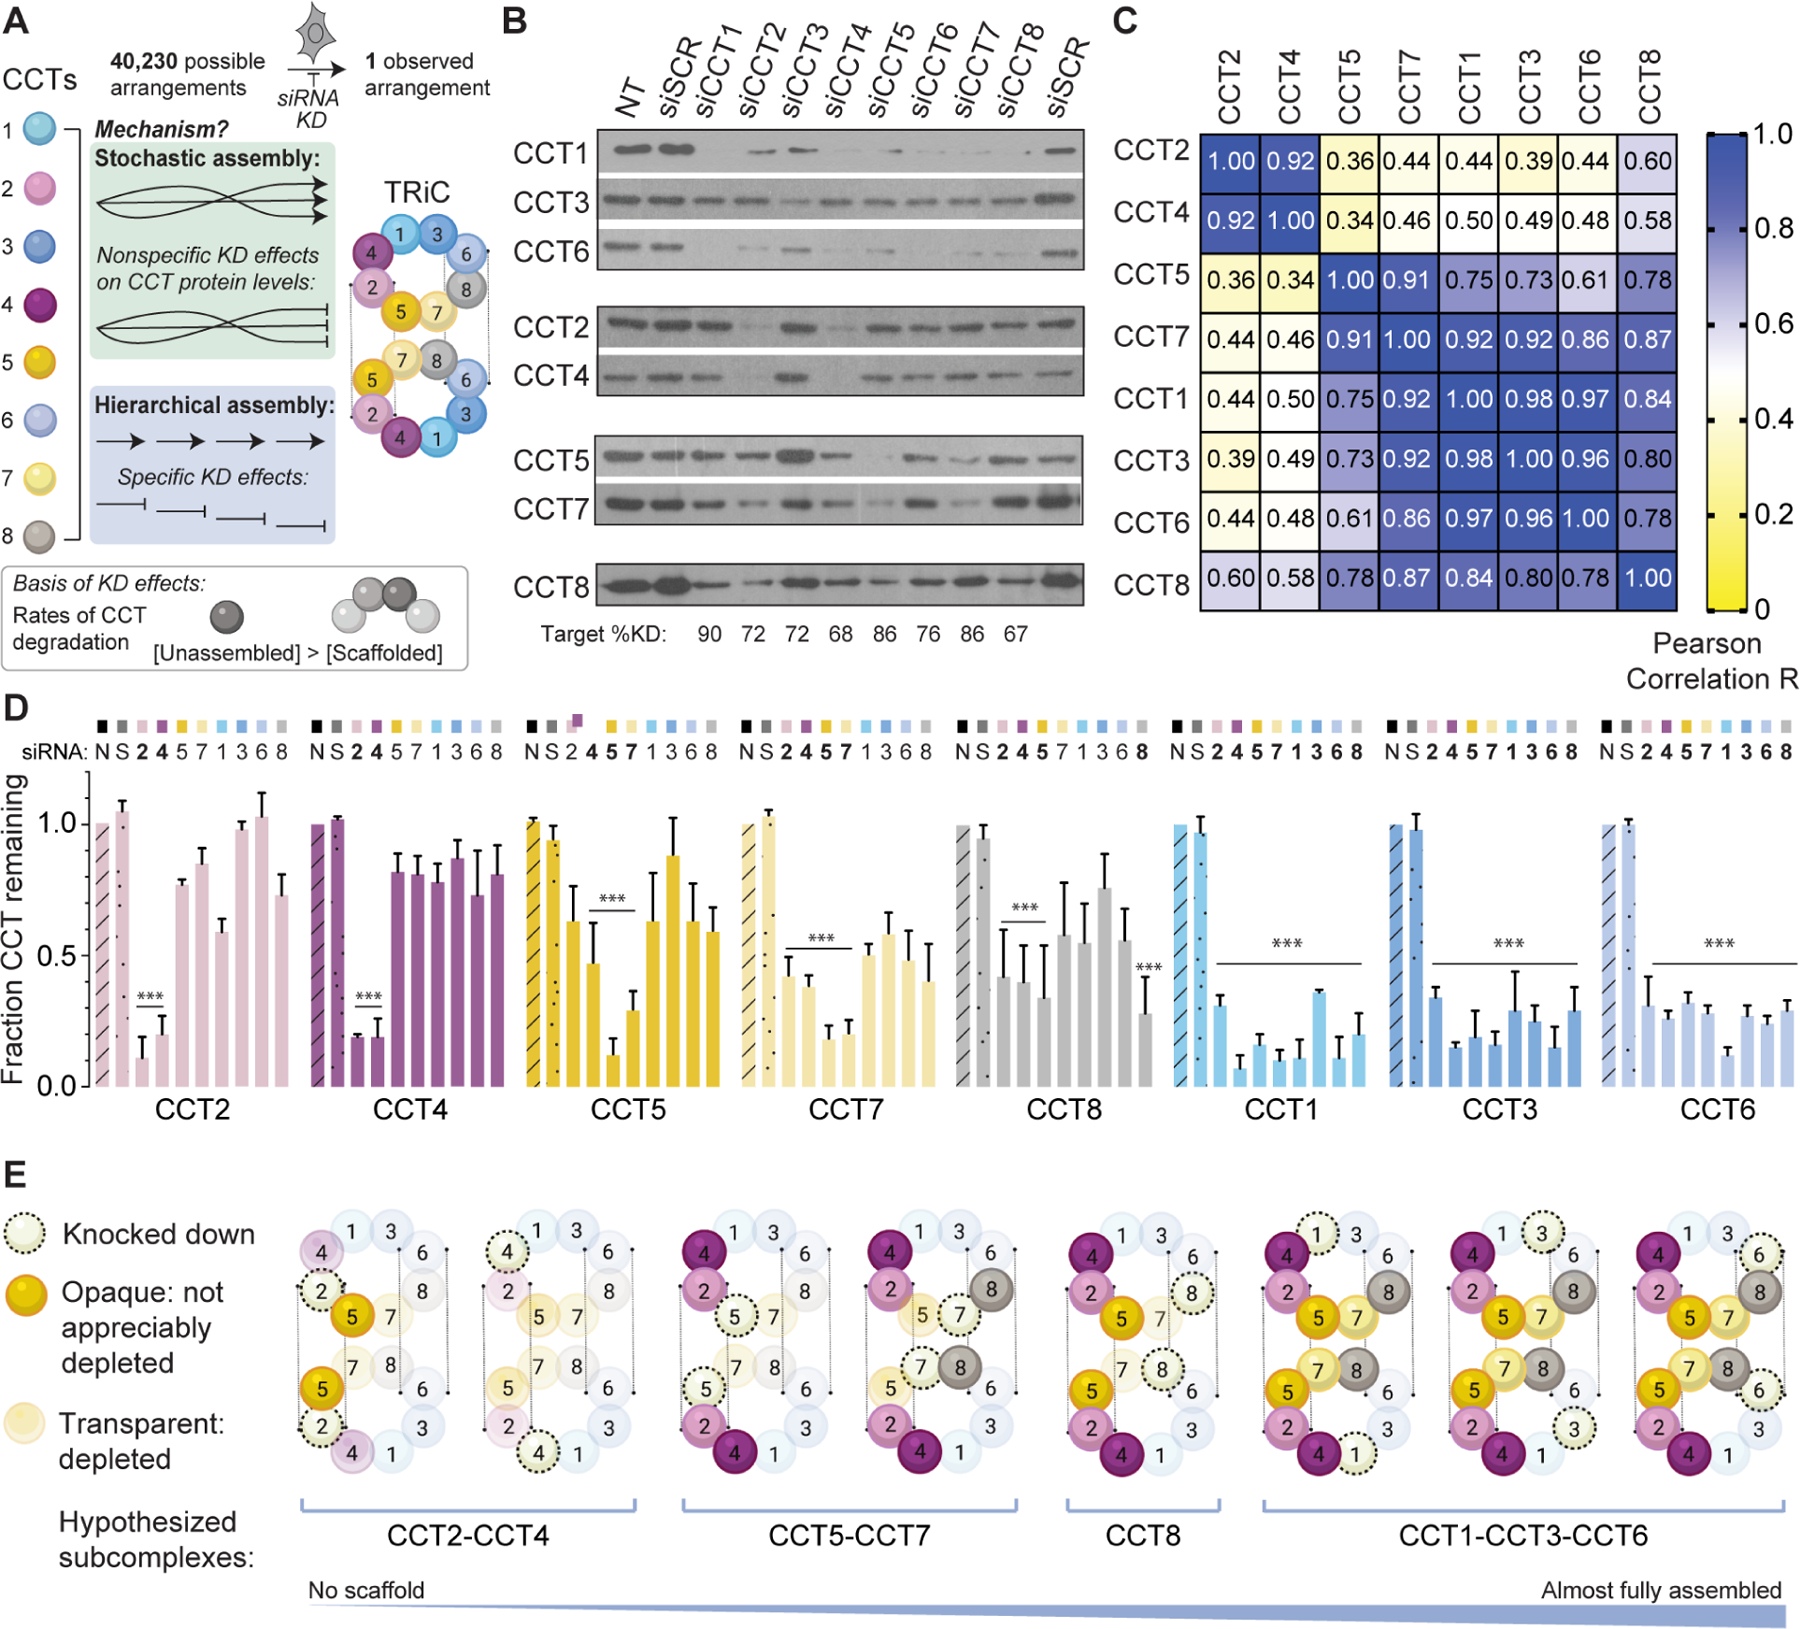
Figure 1. TRiC assembles hierarchically from defined sets of CCT subunits.

A. Unique arrangement of eight CCTs within the TRiC double ring complex and schematic of the knockdown experiment to probe assembly. B. SDS-PAGE immunoblots for each TRiC subunit in HeLa cell lysate following siRNA treatments. NT = non-transfected; siSCR = scrambled siRNA control. Subunits with similar depletion patterns are grouped together. Bottom text indicates knockdown efficiencies. C. Heat map of Pearson correlation coefficients between CCT pairs after knockdowns. D. Fraction of CCT protein remaining after each knockdown (top) normalized to NT control (n=3, errors bars represent SEM, *** = p < 0.0001 using two-way ANOVA and Dunnett’s multiple comparisons test). E. Summary of the TRiC subunit depletion patterns incorporated into a proposed assembly order. See also Figure S1.
