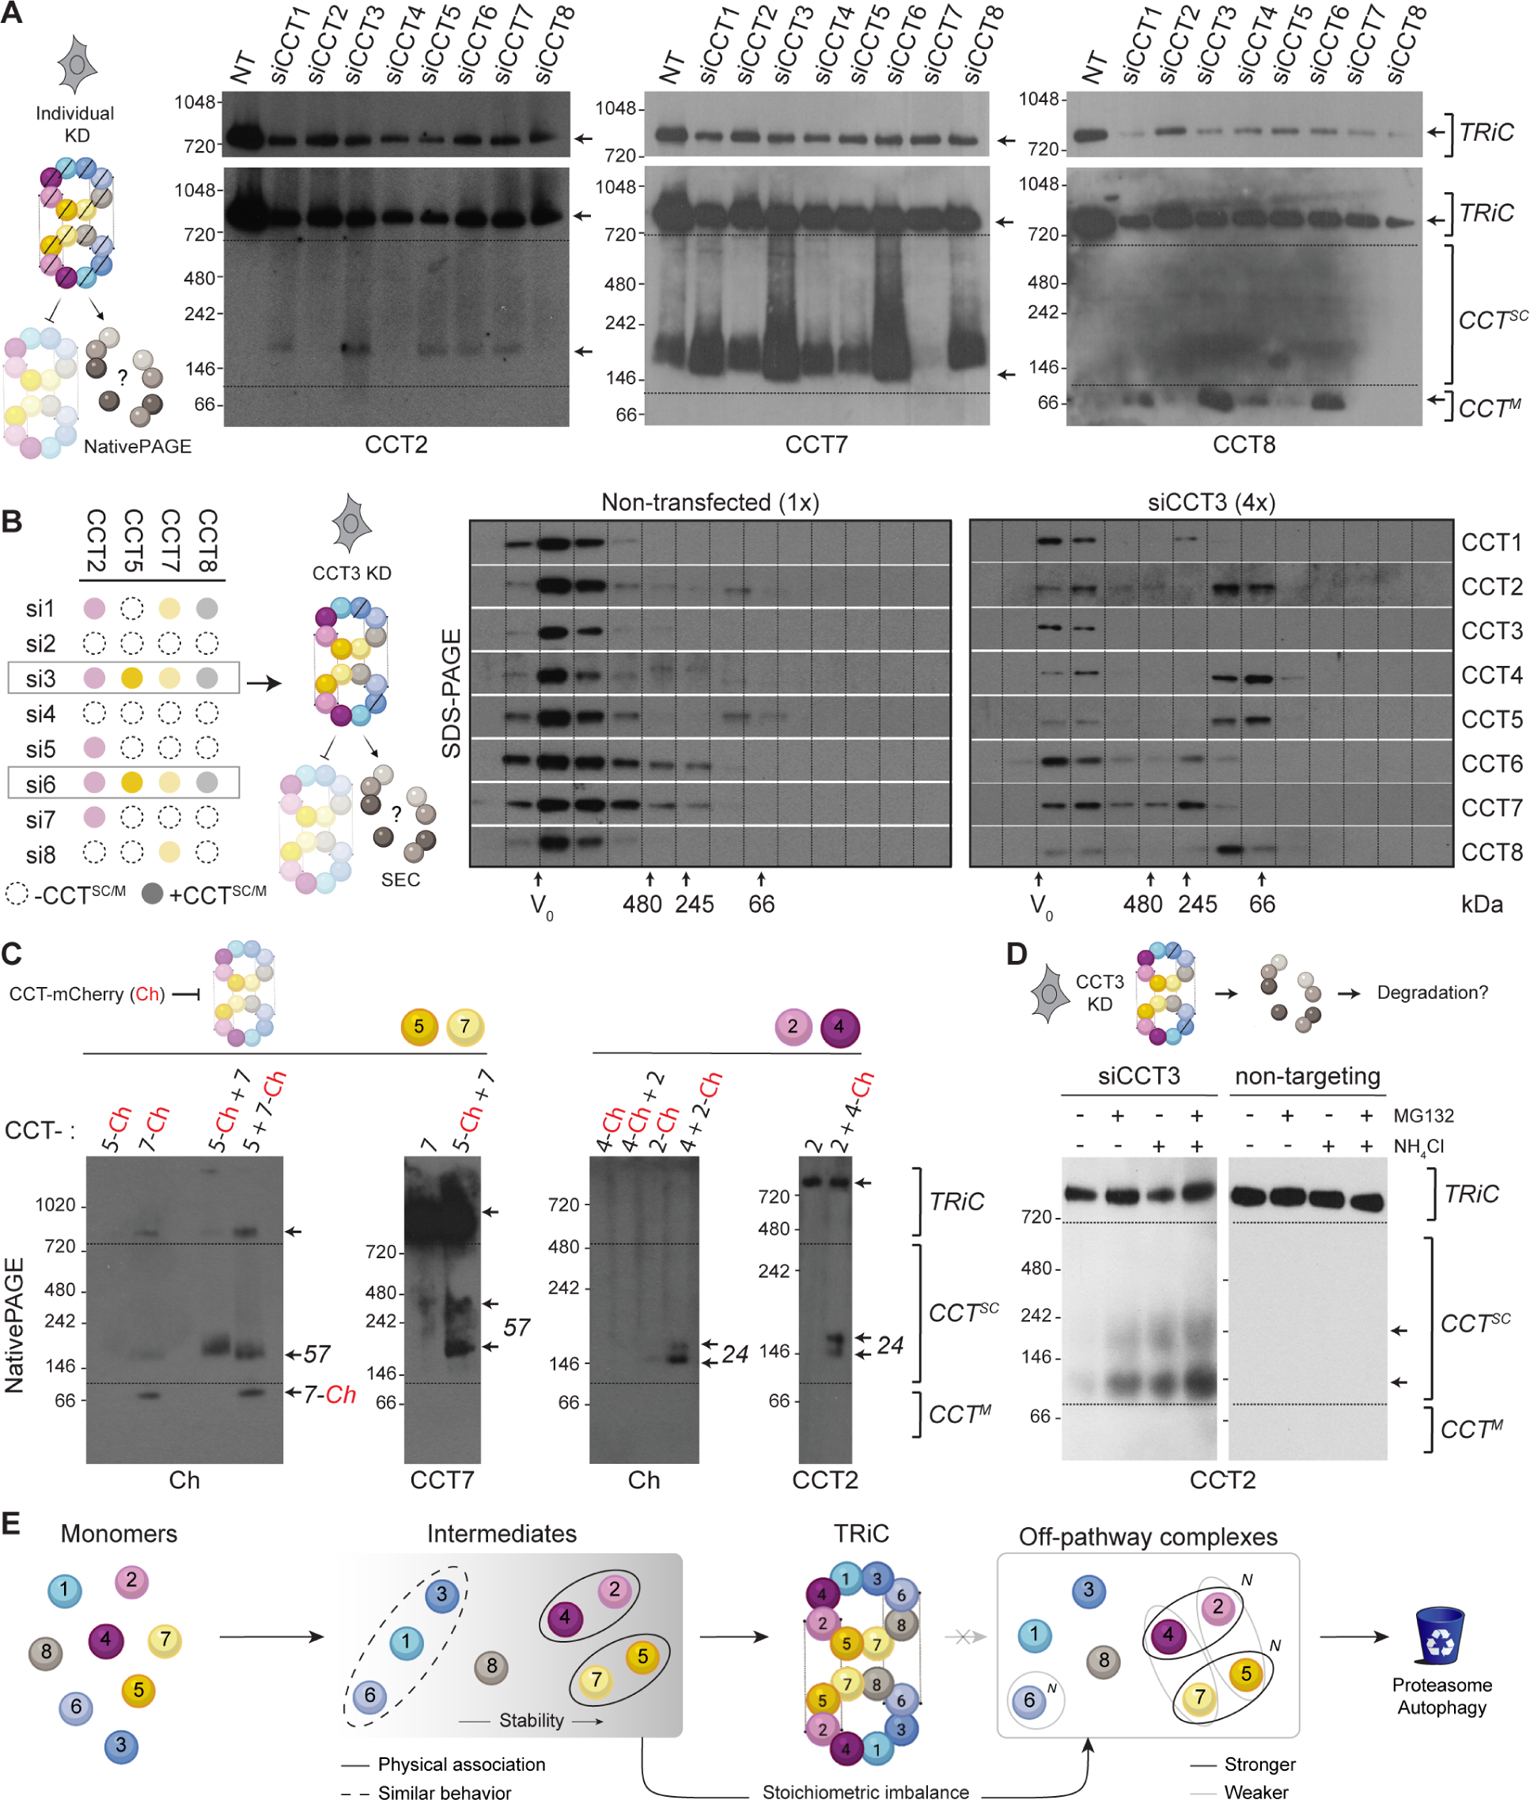
Figure 2. Unintegrated CCTs form selective subcomplexes in cells.

A. NativePAGE immunoblots of HeLa cell lysates after individual CCT knockdowns. Low exposure blots (top) show TRiC depletion; higher exposure blots (bottom) highlight subcomplexes (CCTsc) or monomers (CCTM). Representative blots from each CCT subset with detectable species smaller than TRiC are shown; Figure S2 contains blots for remaining subunits. NT = non-transfected. B. Left, summary of results from A informing right, immunoblots of HeLa cell lysate depleted of CCT3 compared to control lysate after fractionation by size exclusion chromatography. TRiC elutes near the void volume V0; subcomplexes elute in later fractions. Due to clearance mechanisms and signal dispersion, 4-fold higher amounts of CCT3 knockdown lysates compared to controls were loaded to detect CCT subcomplexes. C. Subcomplexes between assembly partners CCT5-CCT7 and CCT2-CCT4 detected by NativePAGE after co-overexpression in HeLa cells. The mCherry tag hinders higher-order assembly. D. NativePAGE immunoblots for CCT2 in HeLa cells treated with siRNA targeting CCT3 or scrambled control after treatment with proteasome inhibitor MG132 and/or autophagy inhibitor NH4Cl. E. Summary of in vivo CCT subcomplex capacities based on knockdown and overexpression experiments. N indicates higher-order oligomerization. See also Figure S2.
