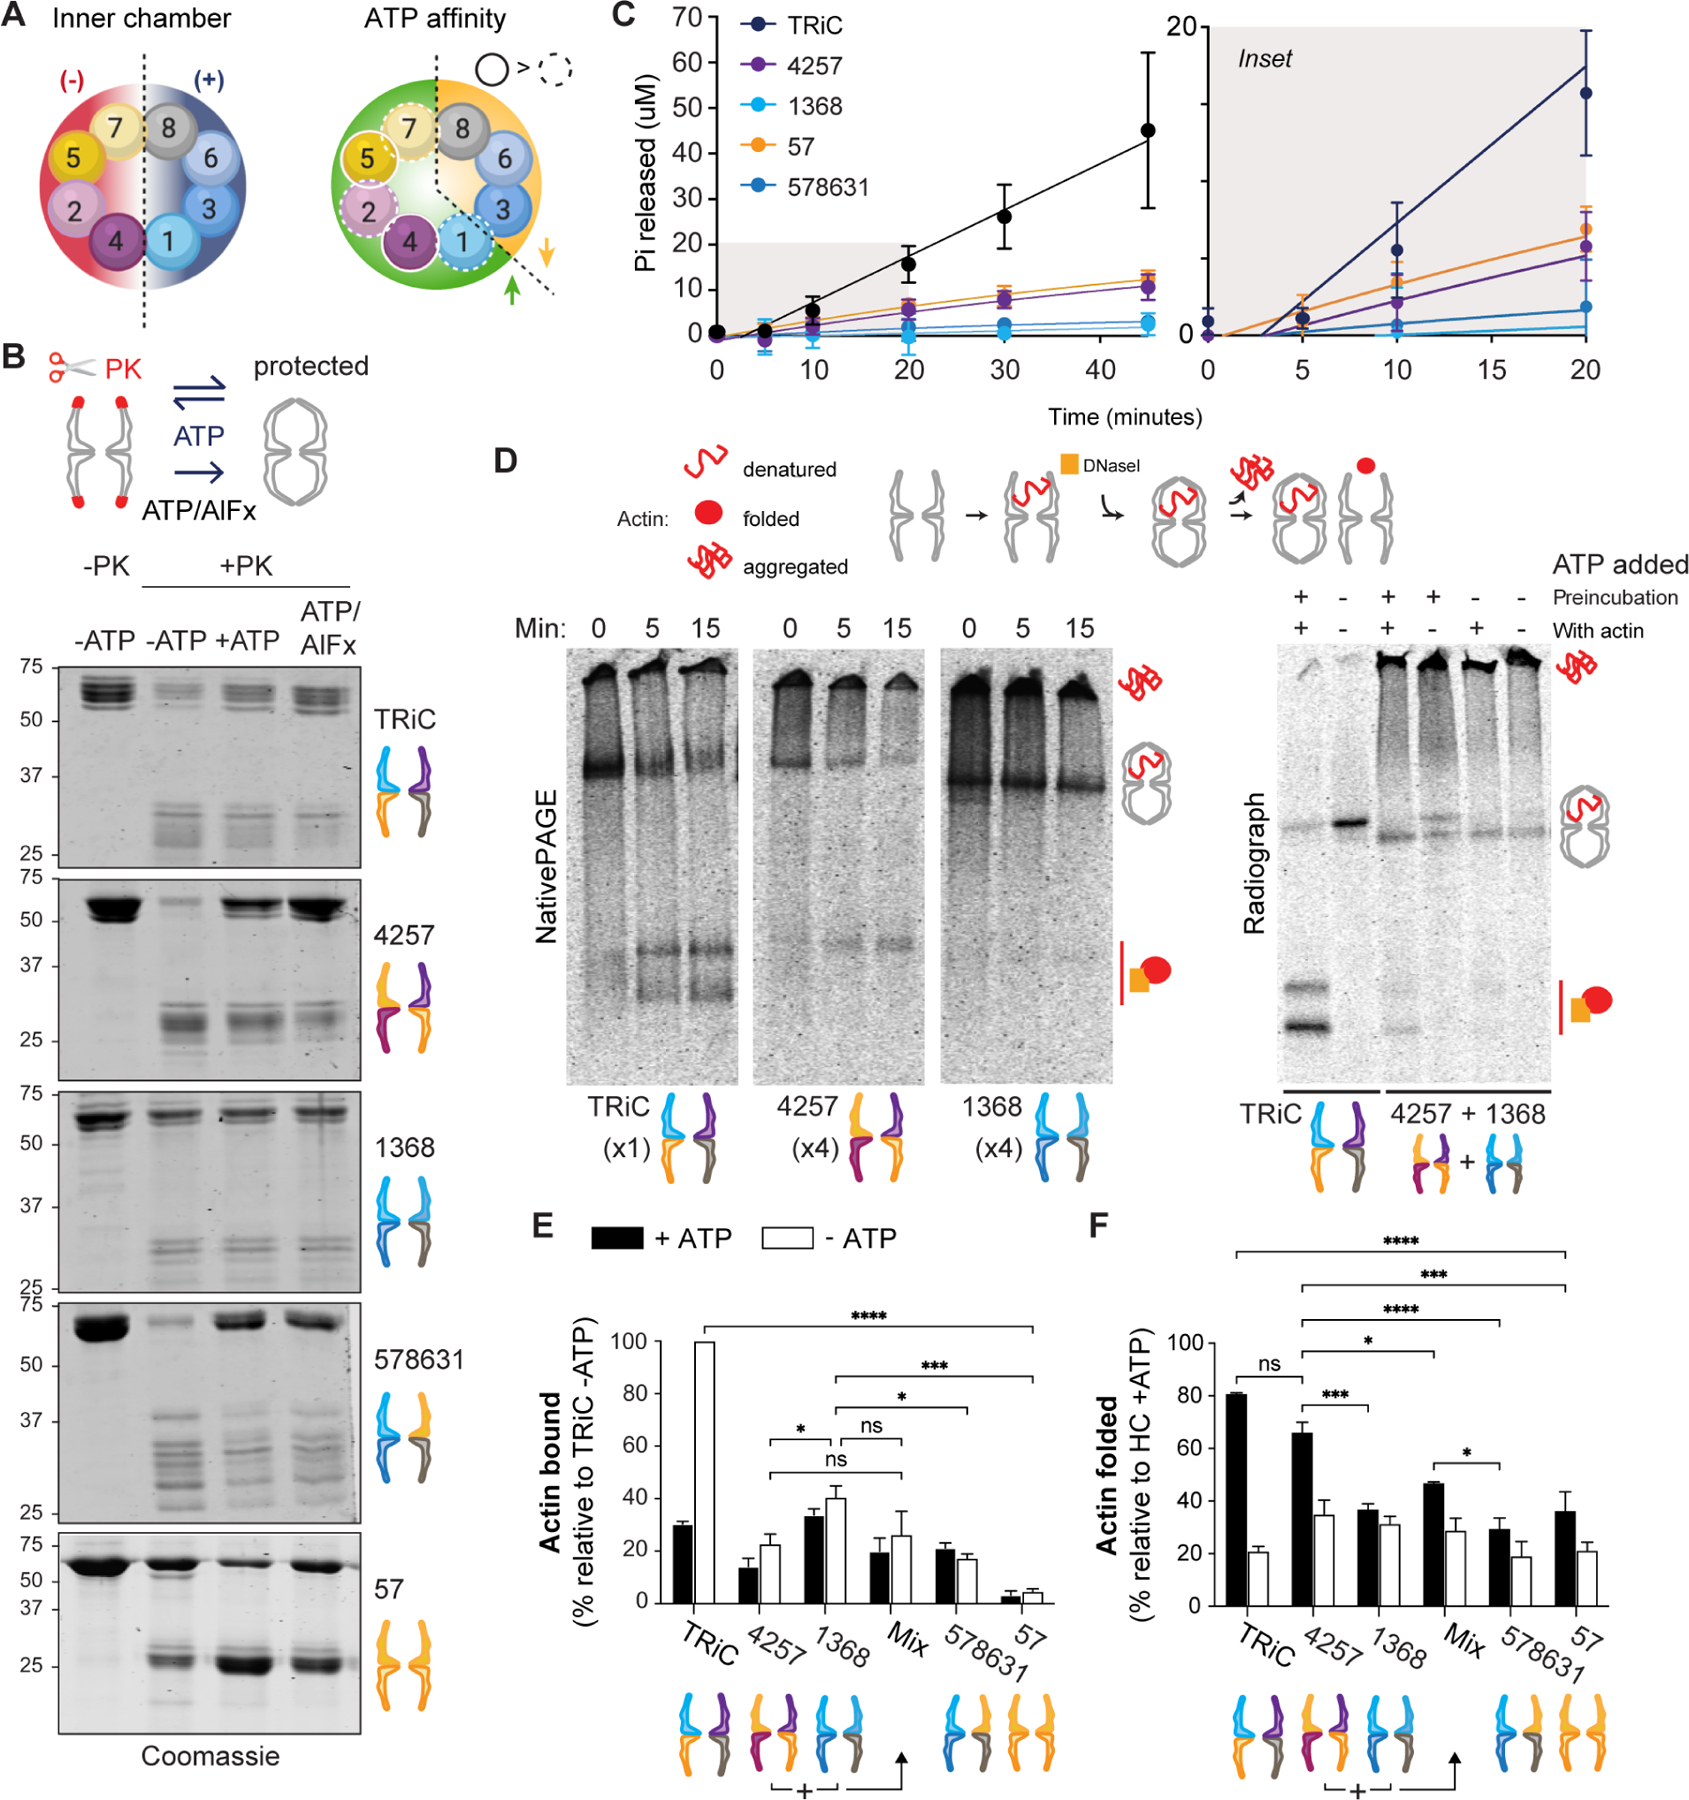
Figure 5. CCT holocomplexes segregate TRiC functions.

A. Segregation of net charge on the inner chamber surface (left) and of ATP affinity (right) within each TRiC ring, and thus between HCs. B. Conformational cycling assay read out by SDS-PAGE. ATP triggers chamber opening (unprotected) and closure (protected). More protection is observed for HCs containing high-ATP-affinity subunits. The transition state analog ATP/AlFx stabilizes the PK-protected state. C. ATPase activity of HCs by quinaldine red assay measuring Pi release over time. Error bars represent the SD. Right, magnified view of early time points. D. Radioactive labeled actin binding and folding assay. Representative radiographs after NativePAGE are shown; additional in Figure S6. Left, 15 minute time course in presence of ATP; right, the same assay using HCCCT4257 and HCCCT1368 incubated together for 30 minutes at 30°C (+/− ATP during preincubation) prior to introducing actin (+/− ATP). E. Actin bound by HCs relative to actin bound by TRiC (n = 3). F. Actin folded as a percentage of total actin present with each HC (n = 3). Error bars represent SEM. ns = not significant if p> 0.05, * p < 0.05, ** p < 0.01, *** p < 0.001, **** p < 0.0001. All statistical comparisons to TRiC not indicated reached significance p < 0.01 (**). Two-way ANOVA, Tukey’s multiple comparisons test. See also Figure S5.
