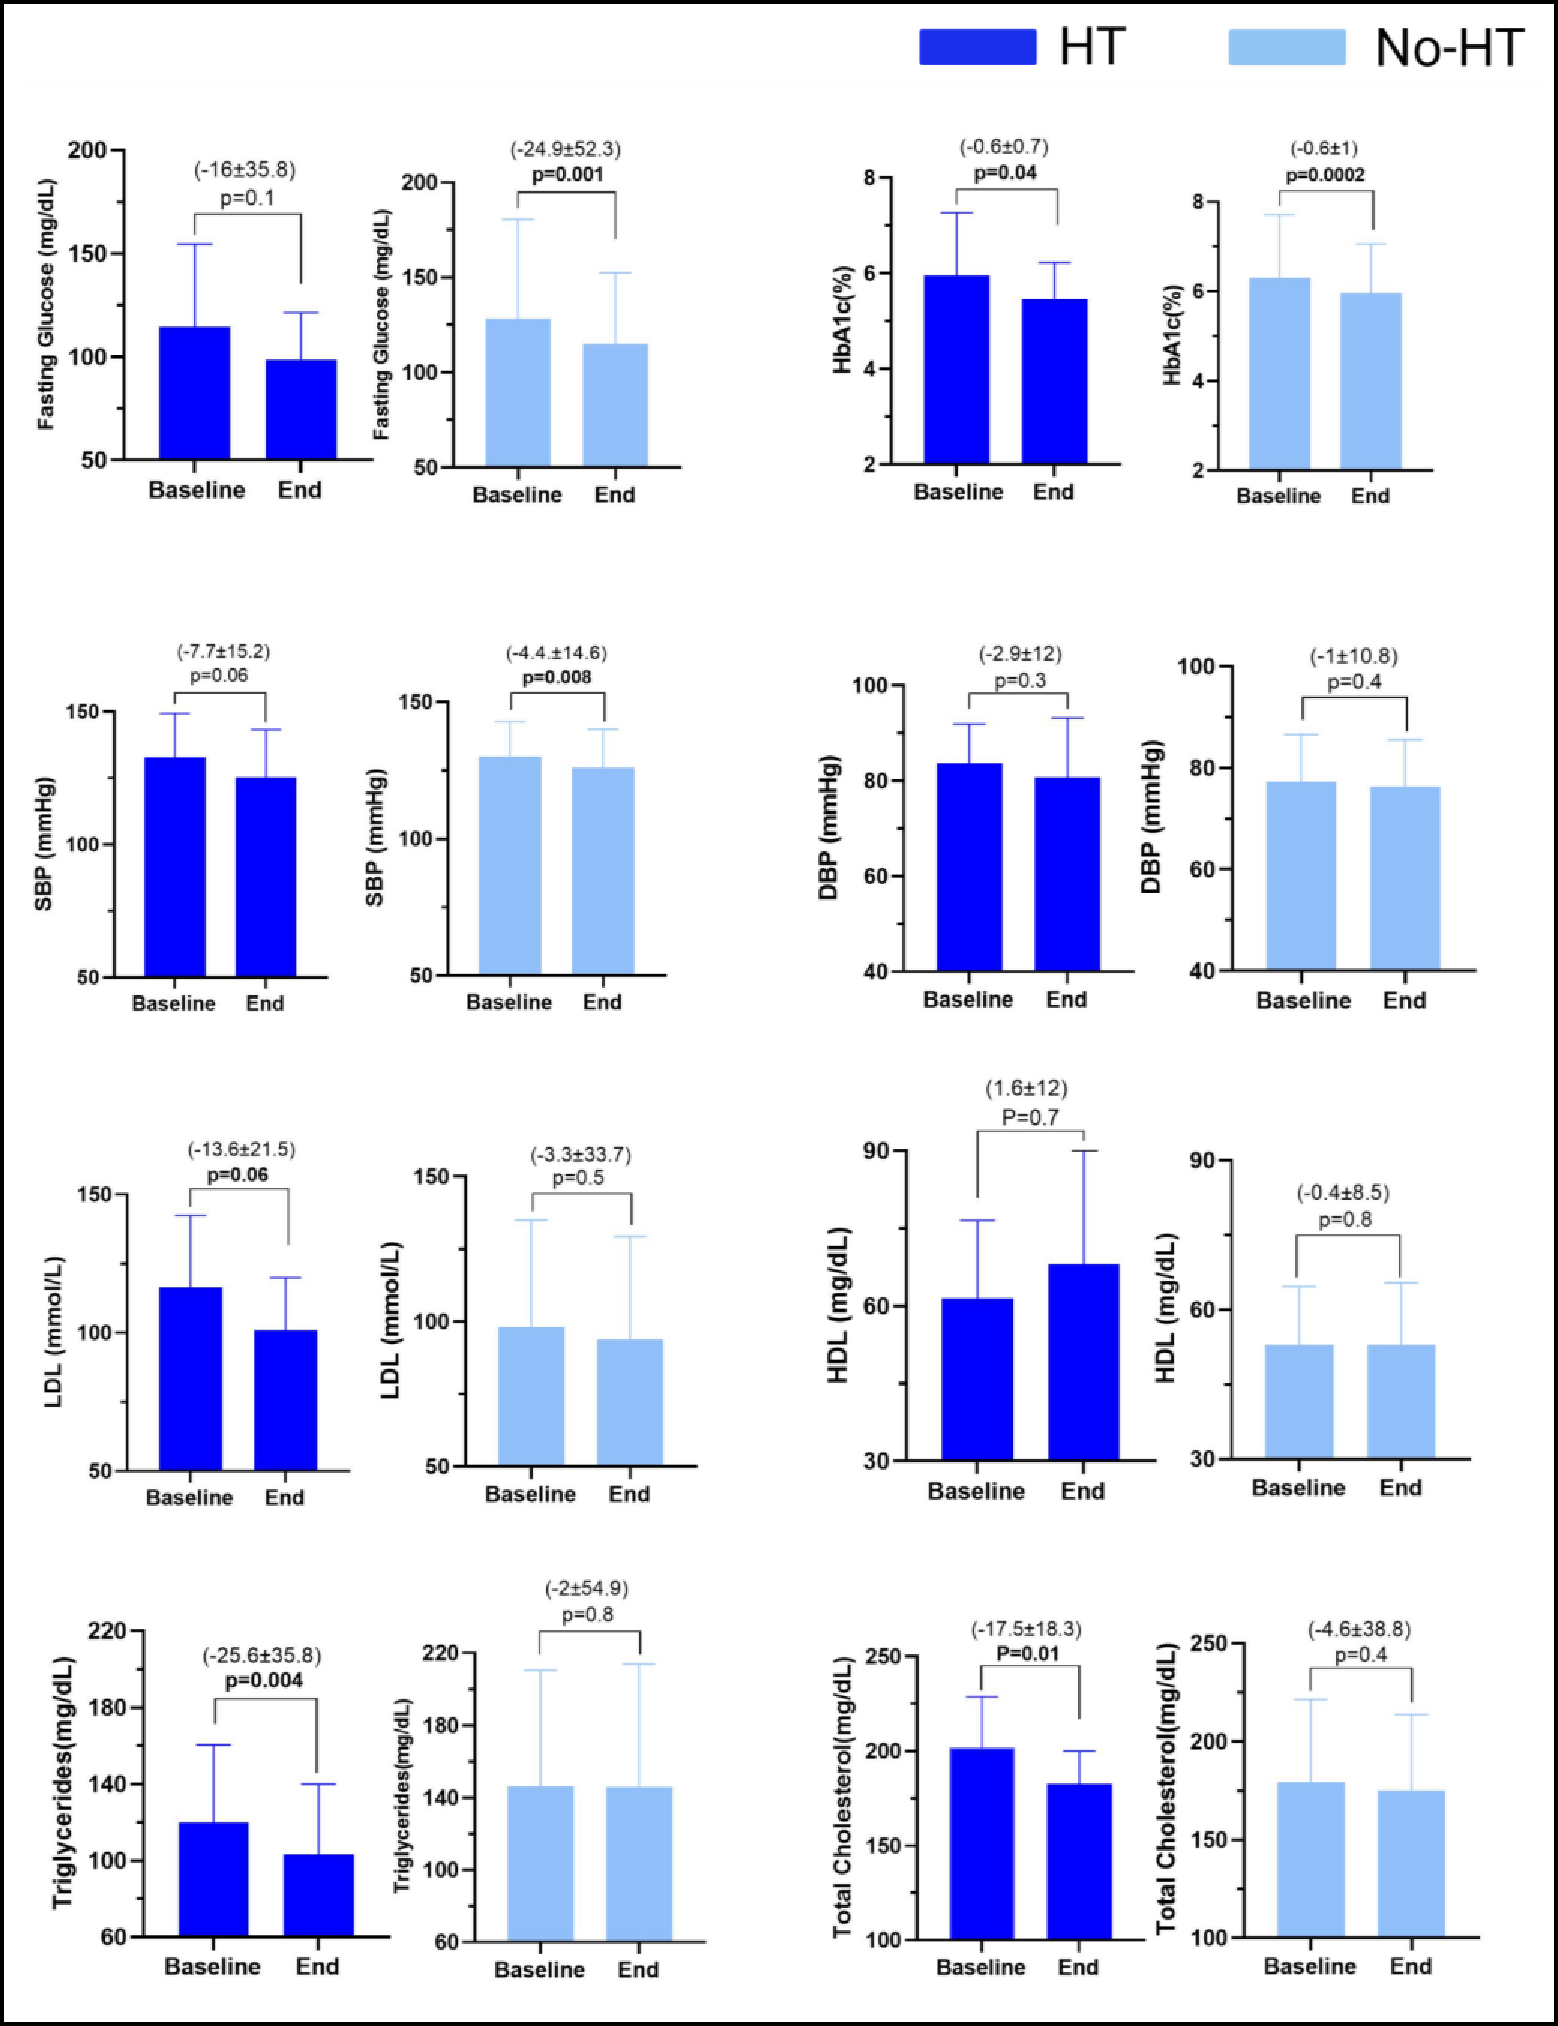
Figure 3. Changes in Fasting Glucose, HbA1c, Lipid Profile, and Blood Pressure by Hormone Therapy Use in All Women (n=106).

Abbreviations used: DBP, Diastolic Blood Pressure; HbA1c, Glycosylated Hemoglobin; HDL, High Density Lipoprotein; HT, With Hormone Therapy; LDL, Low Density Lipoprotein; no-HT, Without Hormone Therapy; SBP, Systolic Blood Pressure; SD, Standard Deviation.
All P values <0.05 are considered significant.
Data in the figures is presented as mean ± standard deviation.
