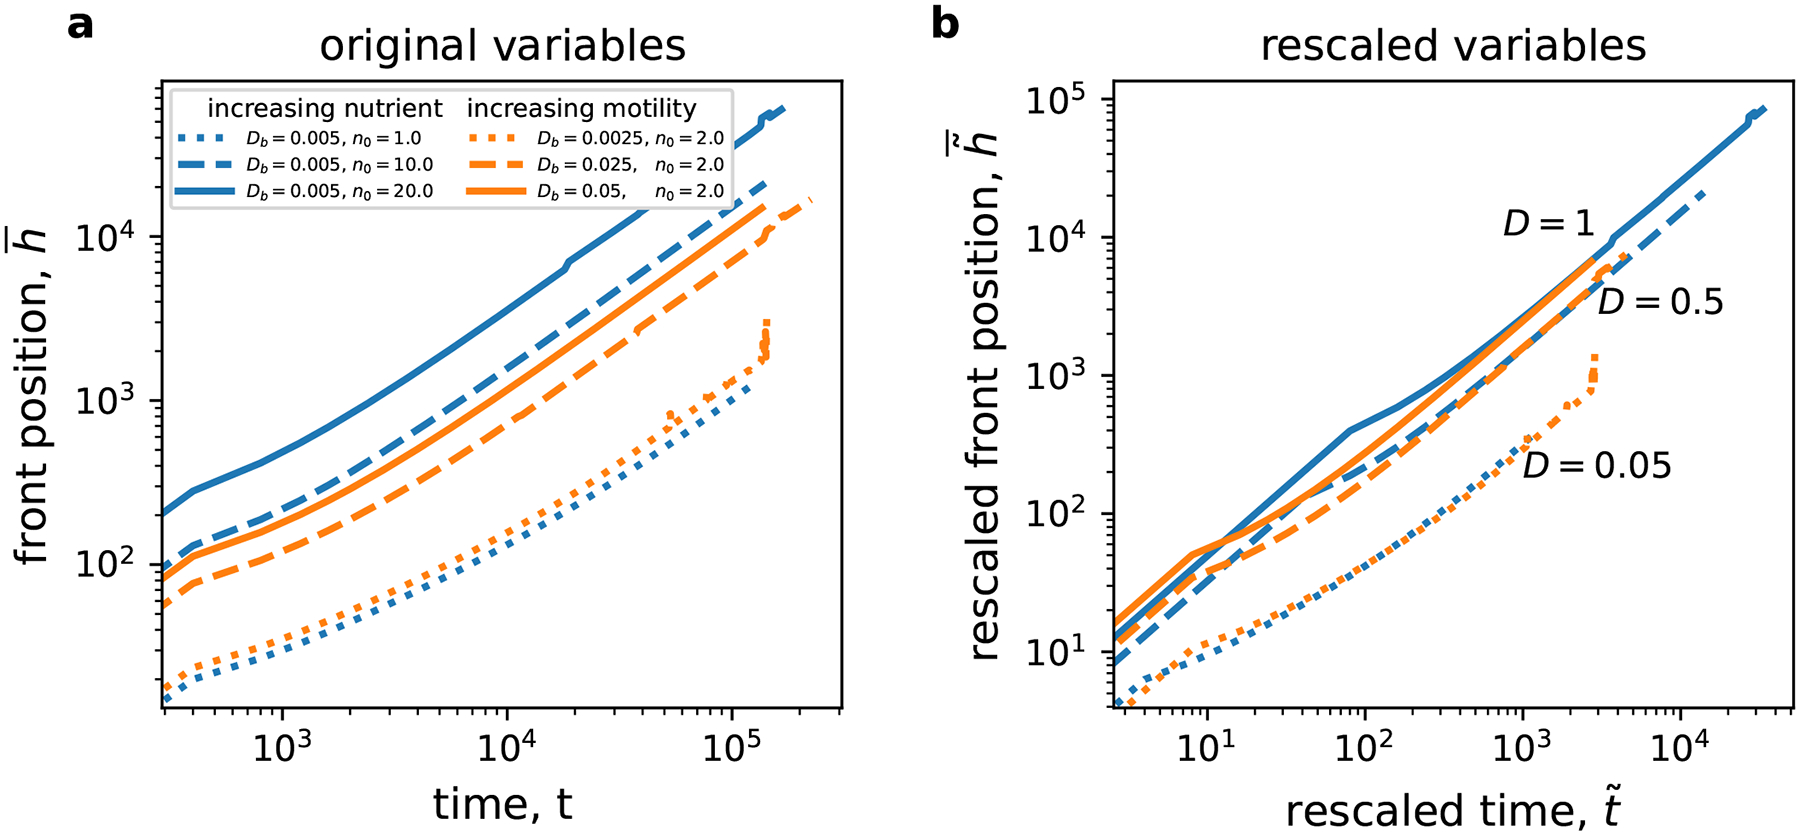
Figure 3. Expansion velocities agree with dimensional analysis.

After an initial transient, the expansion proceeds with a constant velocity, i.e. is linear in . Data with the same value for are shown with the same linestyles (dotted, dashed, and solid), and the color indicates whether we changed the nutrient levels (blue) or the motility (orange). Original variables, without rescaling, are used in (a). It is clear that both and increase the expansion rate, although the nutrient level has a greater effect. Panel (b) demonstrates that is the only factor controlling the expansion dynamics after rescaling according to Eqs. (6). The relative error of the mean is less than 1% in all simulations.
